Financial Report and Registration Document 2010 - Groupe Seb
Financial Report and Registration Document 2010 - Groupe Seb
Financial Report and Registration Document 2010 - Groupe Seb

Create successful ePaper yourself
Turn your PDF publications into a flip-book with our unique Google optimized e-Paper software.
1<br />
GROUPE SEB IN <strong>2010</strong><br />
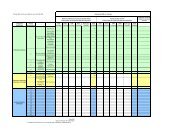
SOCIAL PERFORMANCE INDICATORS<br />
COLLECTIVE AGREEMENTS<br />
(Worldwide)<br />
France<br />
Other Western<br />
European countries Central Europe North America South America Asia & Pacific Total<br />
<strong>2010</strong> 23 38 6 3 6 14 90<br />
2009 44 34 3 0 10 5 96<br />
A total of 90 collective agreements were signed in <strong>2010</strong>, 74% of which were international. The reduction in the number of agreements in France can be<br />
explained by the signature of consolidated agreements at Group level <strong>and</strong> not solely by the legal entity.<br />
1<br />
EXTERNAL LABOUR<br />
(Worldwide)<br />
Temporary staff at 31 December <strong>2010</strong> was equivalent to 567 full-time posts in France (2009: 481 posts) <strong>and</strong> 3,119 posts worldwide (2009: 2,434 posts).<br />
NB: In China, this type of contract does not exist.<br />
PAID OVERTIME<br />
(Worldwide)<br />
<strong>2010</strong>: In France, 49,969 hours, or 27 full time-equivalent (FTE) (2009:<br />
45,869 hours or 25 FTE).<br />
<strong>2010</strong>: worldwide excluding Supor, 420,028 hours, or 205 FTE (2009:<br />
273,076 hours or 135 FTE).<br />
<strong>2010</strong>: 5,429,380 hours for Supor, the Chinese subsidiary, or 2,610 FTE (2009:<br />
4,069,516 hours or 1,981 FTE). These figures are linked to the local context,<br />
with in particular, an increase in trading activity <strong>and</strong> tensions on the<br />
recruitment of labour in Eastern China in <strong>2010</strong>.<br />
WORKPLACE SAFETY: FREQUENCY AND SEVERITY<br />
(Worldwide excluding Supor)<br />
<strong>2010</strong> 2009 2008<br />
WORLDWIDE (EXCLUDING SUPOR)<br />
Number of workplace accidents with subsequent absence 149 169 182<br />
Number of days lost 6,742 6,841 9,281<br />
Frequency rate (a) 7.40 8.46 8.31<br />
Severity rate (b) 0.34 0.34 0.42<br />
FRANCE<br />
Number of workplace accidents with subsequent absence 105 118 110<br />
Number of days lost 5,864 5,772 6,803<br />
Frequency rate (a) 12.49 13.66 12.25<br />
Severity rate (b) 0.70 0.67 0.75<br />
(a) Number of workplace accidents with absence per million hours worked.<br />
(b) Number of days lost per thous<strong>and</strong> hours worked.<br />
The latter has been updated to reflect the reclassification of 2008 <strong>and</strong> 2009 data.<br />
The number of workplace accidents has decreased at most of the Group’s<br />
sites <strong>and</strong> the frequency rate is down worldwide. Severity rate is stable.<br />
As Supor’s data has not been consolidated for 2008 <strong>and</strong> 2009, it is not<br />
included in the table. For <strong>2010</strong>, worldwide including Supor, we obtain a<br />
frequency rate of 5.83 <strong>and</strong> a severity rate of 0.19.<br />
GROUPE SEB<br />
FINANCIAL REPORT AND REGISTRATION DOCUMENT <strong>2010</strong><br />
29