Financial Report and Registration Document 2010 - Groupe Seb
Financial Report and Registration Document 2010 - Groupe Seb
Financial Report and Registration Document 2010 - Groupe Seb

Create successful ePaper yourself
Turn your PDF publications into a flip-book with our unique Google optimized e-Paper software.
3<br />
CONSOLIDATED FINANCIAL STATEMENTS<br />
NOTES TO THE CONSOLIDATED FINANCIAL STATEMENTS<br />
19.2. STOCK OPTIONS AND PERFORMANCE SHARES<br />
19.2.1. Stock options<br />
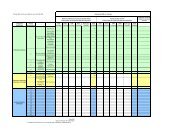
Information about stock option plans at 31 December <strong>2010</strong> is provided below:<br />
STOCK OPTIONS<br />
At 31 December <strong>2010</strong> Date Number of options**<br />
Type of option<br />
Option grant<br />
date***<br />
Option<br />
exercise date<br />
Option expiry<br />
date Granted Exercised Cancelled<br />
Outst<strong>and</strong>ing<br />
Exercise price**<br />
(in €)<br />
To purchase<br />
existing shares 19/04/2002 19/04/2006 19/04/<strong>2010</strong> 417,450 396,000 21,450 0 27.88<br />
To purchase<br />
existing shares 17/10/2002 17/10/2006 17/10/<strong>2010</strong> 598,125 488,895 109,230 0 25.15<br />
To purchase<br />
existing shares 18/06/2003 18/06/2007 18/06/2011 612,150 544,824 27,730 39,596 24.24<br />
To purchase<br />
existing shares 18/06/2004 18/06/2008 18/06/2012 539,100 308,104 17,400 213,596 31.67<br />
To purchase<br />
existing shares 08/04/2005 08/04/2009 08/04/2013 554,700 376,267 20,100 158,333 28.00<br />
To purchase<br />
existing shares 16/06/2006 16/06/<strong>2010</strong> 16/06/2014 589,798 294,594 14,707 280,497 29.33<br />
To purchase<br />
existing shares 20/04/2007 20/04/2011 20/04/2015 579,150 0 8,100 571,050 44.00<br />
To purchase<br />
existing shares 13/05/2008 13/05/2012 13/05/2016 1,005,900 0 17,700 988,200 38.35<br />
To purchase<br />
existing shares 12/06/2009 12/06/2013 12/06/2017 371,300 0 1,050 370,250 28.05<br />
To purchase<br />
existing shares 18/06/<strong>2010</strong> 18/06/2014 18/06/2018 412,592 0 0 412,592 53.86<br />
TOTAL* 5,680,265 2,408,684 237,467 3,034,114<br />
* Of which, movements in <strong>2010</strong> 412,592 1,153,549 36,452 (777,409)<br />
Total options to purchase existing shares 5,680,265 2,408,684 237,467 3,034,114<br />
Total options to purchase new shares 0 0 0 0<br />
3<br />
** The number of options <strong>and</strong> the exercise price for plans prior to 16 June 2008 were adjusted following the three-for-one stock split that took place on 16 June 2008.<br />
*** The grant date corresponds to the date of the Board Meeting when the option grants were decided.<br />
In accordance with IFRS 2 – Share-Based Payment, stock options are<br />
measured at the grant date. The valuation method used is based on the<br />
Black & Scholes option pricing model. The initial valuation is not adjusted<br />
for any subsequent changes in value after the grant date.<br />
The value is recognised in employee benefits expense on a straight-line basis<br />
over the option vesting period by adjusting equity.<br />
IFRS 2 has been applied only to stock options granted after 7 November<br />
2002 that had not yet vested at 1 January 2005. As allowed under IFRS 2,<br />
options granted before 7 November 2002 have not been measured or<br />
recognised in the accounts.<br />
The amount recognised in employee benefits expense in <strong>2010</strong> in respect of stock options was €5.0 million, versus €5.8 million in 2009 <strong>and</strong> €4.7 million in<br />
2008. The assumptions used to value options under the Black & Scholes model are as follows:<br />
<strong>2010</strong> plan 2009 plan 2008 plan 2007 plan 2006 plan<br />
INITIAL VALUE (IN € MILLIONS) 4.5 2.1 8.7 6.8 2.5<br />
AMOUNT RECOGNISED IN EMPLOYEE<br />
BENEFITS EXPENSE (IN € MILLIONS) 0.7 0.6 2.0 1.5 0.2<br />
ASSUMPTIONS<br />
Share price at the option grant date (in €) 53.9 29.7 37.6 44.0 29.3<br />
Volatility 25.0% 26.0% 25.0% 30.0% 20.0%<br />
Risk-free interest rate 3.40% 3.50% 4.50% 4.42% 3.80%<br />
Exercise price (in €) 53.86 28.05 38.35 44.00 29.33<br />
Life of the options (in years) (a) 5 5 5 5 5<br />
Dividend rate 2.8% 3.0% 2.5% 2.0% 3.0%<br />
(a) Corresponding to the average exercise period.<br />
GROUPE SEB<br />
FINANCIAL REPORT AND REGISTRATION DOCUMENT <strong>2010</strong><br />
91