3 FINANCIAL CONSOLIDATED FINANCIAL STATEMENTS SUMMARY FINANCIAL SUMMARY (in € millions) <strong>2010</strong> 2009 2008 2007 (i) 2006 (i) 2005 IFRS (c) (i) 2004 IFRS (b) 2004 (b) 2003 2002 (a) 2001 RESULTS Sales in France 712 685 668 640 595 591 624 636 660 660 527 Sales outside France 2,940 2,491 2,562 2,230 2,057 1,872 1,665 1,703 1,688 1,836 1,328 Total sales 3,652 3,176 3,230 2,870 2,652 2,463 2,289 2,339 2,348 2,496 1,855 Operating margin 438 355 342 301 262 262 261 248 234 217 175 Operating profit 349 248 279 237 153 183 187 175 196 143 119 Profit attributable to owners of the parent 220 146 152 145 87 102 131 123 148 118 74 Depreciation, amortisation <strong>and</strong> impairment losses 117 124 110 88 97 114 85 91 86 95 83 Employee benefits expense (d) 627 549 563 540 534 516 499 506 514 536 424 Discretionary <strong>and</strong> non-discretionary profit sharing <strong>and</strong> matching contributions to employee savings plans 50 33 38 33 26 29 34 34 36 51 29 EBITDA (e) 468 372 388 329 247 291 270 259 278 230 196 Adjusted EBITDA (h) 488 416 394 351 324 323 310 296 279 252 222 BALANCE SHEET (AT 31 DECEMBER) Equity attributable to owners of the parent 1,512 1,169 992 814 770 757 644 642 557 471 464 Net debt 131 243 649 658 422 423 331 331 189 327 404 Non-current assets 1,249 1,163 1,184 1,060 766 773 679 624 476 481 535 Capital expenditure 140 109 116 92 85 99 99 87 99 85 81 Inventories 635 466 615 528 517 450 386 387 359 415 352 Trade receivables 733 627 646 627 646 630 552 552 544 580 471 Number of employees at 31 December 23,058 20,663 18,879 13,048 13,741 14,396 14,500 14,500 14,690 15,780 13,939 PER SHARE DATA (IN €) (J) Total number of shares outst<strong>and</strong>ing (in thous<strong>and</strong>s) 49,952 49,952 50,912 50,881 51,057 50,940 51,228 51,228 46,347 46,317 46,320 Weighted average number of shares, excluding treasury stock (in thous<strong>and</strong>s) 47,414 46,477 47,326 48,620 48,610 48,888 48,468 48,468 48,369 48,306 48,276 Adjusted diluted earnings per share (g) 4.55 3.13 3.18 2.92 1.78 2.07 2.67 2.52 3.02 2.42 1.53 Dividend per share (g) 1.17 1.04 0.94 0.93 0.85 0.80 0.80 0.80 0.76 0.65 0.61 Dividend yield per share (in %) (f) (g) 1.51 2.62 4.38 2.26 2.37 2.61 3.04 3.04 2.52 2.56 3.19 Share price: High (g) 82.78 40.53 44.00 48.15 38.07 30.88 35.73 35.73 32.12 29.11 20.85 Low (g) 39.15 16.44 19.71 35.33 26.70 26.10 24.45 24.45 20.92 18.48 11.85 Share price at 31 December 77.73 39.70 21.46 41.33 35.87 30.67 26.30 26.30 30.00 25.64 18.98 Stock market capitalisation (in € millions) 3,882.8 1,983 1,093 2,103 1,831 1,562 1,347 1,347 1,529 1,306 967 Average daily trading volume (number of shares) 107,282 88,830 117,527 127,638 75,681 63,243 87,183 87,183 85,608 74,664 65,547 (a) Including the new Moulinex subsidiaries since 1 January 2002. (b) Including All-Clad since 28 July 2004. (c) Including Lagostina since 1 May 2005 <strong>and</strong> Panex since 1 June 2005. (d) Excluding discretionary <strong>and</strong> non-discretionary profit sharing <strong>and</strong> matching contributions to employee savings plans but including temporary staff costs. From 2004, the reported amounts also include the service cost of pension <strong>and</strong> other post-employment benefits. (e) Earnings before interest, taxes, depreciation <strong>and</strong> amortisation (including amortisation <strong>and</strong> impairment of goodwill <strong>and</strong> trademarks, <strong>and</strong> depreciation <strong>and</strong> amortisation expense reported under “Other operating income <strong>and</strong> expense”). (f) Dividend for the year expressed as a percentage of the closing share price at the year-end. (g) Adjusted for the March 2004 one-for-ten bonus share issue. (h) Earnings before interest, taxes, depreciation <strong>and</strong> amortisation (including amortisation <strong>and</strong> impairment of losses reported under “Other operating income <strong>and</strong> expense”). (i) The balance sheet <strong>and</strong> income statements for 2005, 2006 <strong>and</strong> 2007 were adjusted in subsequent years. The adjustments were not material. (j) Adjusted for the three-for-one stock-split. 60 FINANCIAL REPORT AND REGISTRATION DOCUMENT <strong>2010</strong> GROUPE SEB
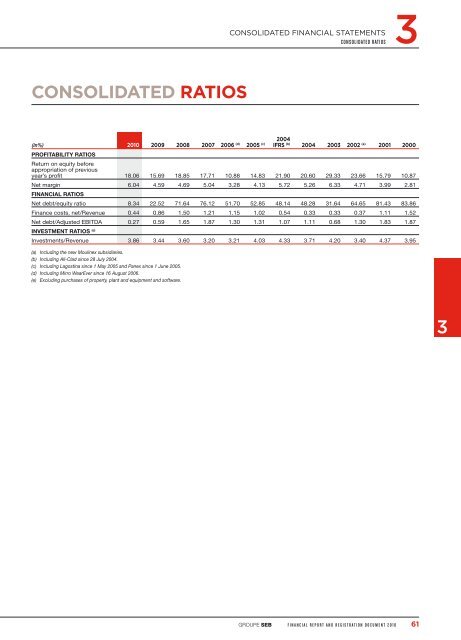
3 CONSOLIDATED FINANCIAL STATEMENTS CONSOLIDATED RATIOS CONSOLIDATED RATIOS (in%) <strong>2010</strong> 2009 2008 2007 2006 (d) 2005 (c) 2004 IFRS (b) 2004 2003 2002 (a) 2001 2000 PROFITABILITY RATIOS Return on equity before appropriation of previous year’s profit 18.06 15.69 18.85 17.71 10.88 14.83 21.90 20.60 29.33 23.66 15.79 10.87 Net margin 6.04 4.59 4.69 5.04 3.28 4.13 5.72 5.26 6.33 4.71 3.99 2.81 FINANCIAL RATIOS Net debt/equity ratio 8.34 22.52 71.64 76.12 51.70 52.85 48.14 48.28 31.64 64.65 81.43 83.86 Finance costs, net/Revenue 0.44 0.86 1.50 1.21 1.15 1.02 0.54 0.33 0.33 0.37 1.11 1.52 Net debt/Adjusted EBITDA 0.27 0.59 1.65 1.87 1.30 1.31 1.07 1.11 0.68 1.30 1.83 1.87 INVESTMENT RATIOS (e) Investments/Revenue 3.86 3.44 3.60 3.20 3.21 4.03 4.33 3.71 4.20 3.40 4.37 3.95 (a) Including the new Moulinex subsidiaries. (b) Including All-Clad since 28 July 2004. (c) Including Lagostina since 1 May 2005 <strong>and</strong> Panex since 1 June 2005. (d) Including Mirro WearEver since 16 August 2006. (e) Excluding purchases of property, plant <strong>and</strong> equipment <strong>and</strong> software. 3 GROUPE SEB FINANCIAL REPORT AND REGISTRATION DOCUMENT <strong>2010</strong> 61