Financial Report and Registration Document 2010 - Groupe Seb
Financial Report and Registration Document 2010 - Groupe Seb
Financial Report and Registration Document 2010 - Groupe Seb

You also want an ePaper? Increase the reach of your titles
YUMPU automatically turns print PDFs into web optimized ePapers that Google loves.
3<br />
CONSOLIDATED FINANCIAL STATEMENTS<br />
NOTES TO THE CONSOLIDATED FINANCIAL STATEMENTS<br />
NOTE 3<br />
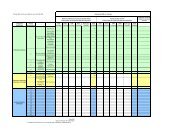
SEGMENT INFORMATION<br />
In accordance with IFRS 8 – Operating Segments, fi nancial information<br />
is presented by geographical segment, which is the basis of the internal<br />
information reviewed <strong>and</strong> used by the chief operating decision makers, i.e.<br />
the members of the Executive Committee.<br />
3.1. GEOGRAPHICAL SEGMENT INFORMATION (BY LOCATION OF ASSETS)<br />
(in € millions)<br />
France<br />
Other Western<br />
European<br />
countries (a)<br />
North<br />
America<br />
South<br />
America<br />
Asia/<br />
Pacific<br />
Central Europe<br />
<strong>and</strong> other<br />
countries<br />
Intra-group<br />
transactions<br />
Total<br />
<strong>2010</strong><br />
Revenue<br />
Inter-segment revenue 711.7 770.7 386.8 344.1 660.2 614.2 3,487.7<br />
External revenue 635.9 46.5 0.8 12.1 756.2 6.4 (1,293.8) 164.1<br />
TOTAL REVENUE 1,347.6 817.2 387.6 356.2 1,416.4 620.6 (1,293.8) 3,651.8<br />
Profit/(loss)<br />
Operating margin 160.4 44.2 (8.8) 24.7 118.3 106.0 (6.9) 437.9<br />
Operating profit 87.0 47.1 (26.3) 20.8 119.8 100.6 349.0<br />
Finance costs <strong>and</strong> other financial<br />
income <strong>and</strong> expense, net (15.9)<br />
Share of profit of associates<br />
Income tax expense (89.5)<br />
NET PROFIT 243.6<br />
Balance sheet<br />
Segment assets 637.9 469.1 339.4 303.6 961.1 241.3 (285.1) 2,667.3<br />
<strong>Financial</strong> assets 261.7<br />
Tax assets 67.0<br />
3<br />
TOTAL ASSETS 2,996.0<br />
Segment liabilities 425.1 279.1 54.7 100.2 239.9 109.0 (240.8) 967.2<br />
Borrowings 378.0<br />
Tax liabilities 79.5<br />
Equity 1,571.3<br />
TOTAL EQUITY<br />
AND LIABILITIES 2,996.0<br />
Other information<br />
Capital expenditure<br />
<strong>and</strong> purchases<br />
of intangible assets 59.4 7.4 5.0 19.1 47.2 2.7 140.8<br />
Depreciation<br />
<strong>and</strong> amortisation expense 59.9 8.2 3.8 9.1 17.4 1.6 100.0<br />
Impairment losses 3.6 14.7 18.3<br />
(a) “Other Western European countries” correspond to the 15 other countries comprising the pre-enlargement European Union. The new EU countries are included in the “Central Europe<br />
<strong>and</strong> other countries” segment.<br />
GROUPE SEB<br />
FINANCIAL REPORT AND REGISTRATION DOCUMENT <strong>2010</strong><br />
75