Technical Reports Parts C,D - ICPDR
Technical Reports Parts C,D - ICPDR
Technical Reports Parts C,D - ICPDR

Create successful ePaper yourself
Turn your PDF publications into a flip-book with our unique Google optimized e-Paper software.
<strong>Technical</strong> <strong>Reports</strong> – Part C: Water Quality 45<br />
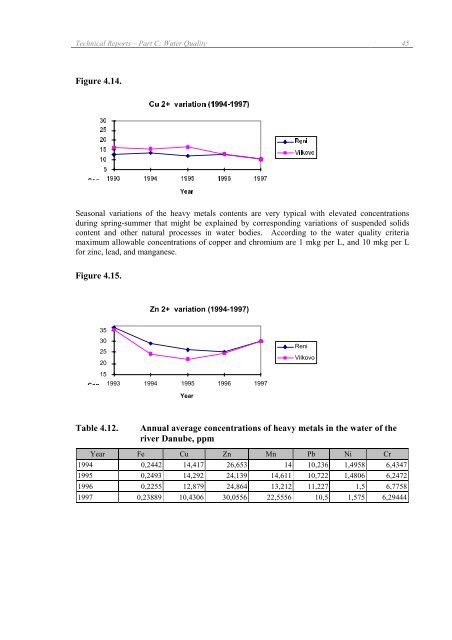
Figure 4.14.<br />
<br />
<br />
<br />
<br />
<br />
<br />
<br />
<br />
<br />
<br />
<br />
<br />
<br />
Seasonal variations of the heavy metals contents are very typical with elevated concentrations<br />
during spring-summer that might be explained by corresponding variations of suspended solids<br />
content and other natural processes in water bodies. According to the water quality criteria<br />
maximum allowable concentrations of copper and chromium are 1 mkg per L, and 10 mkg per L<br />
for zinc, lead, and manganese.<br />
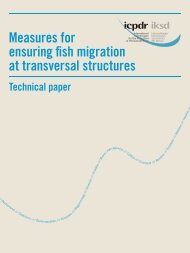
Figure 4.15.<br />
Zn 2+ variation (1994-1997)<br />
35<br />
30<br />
25<br />
20<br />
15<br />
Con 1993 1994 1995 1996 1997<br />
Year<br />
Reni<br />
Vilkovo<br />
Table 4.12.<br />
Annual average concentrations of heavy metals in the water of the<br />
river Danube, ppm<br />
Year Fe Cu Zn Mn Pb Ni Cr<br />
1994 0,2442 14,417 26,653 14 10,236 1,4958 6,4347<br />
1995 0,2493 14,292 24,139 14,611 10,722 1,4806 6,2472<br />
1996 0,2255 12,879 24,864 13,212 11,227 1,5 6,7758<br />
1997 0,23889 10,4306 30,0556 22,5556 10,5 1,575 6,29444