- Page 1: 2012 Annual Report
- Page 4 and 5: Contents PRESENTATION Letter to the
- Page 6 and 7: Letter to the stakeholders Consolid
- Page 8 and 9: Italcementi Group in the world (as
- Page 10 and 11: Highlights Contribution to consolid
- Page 12 and 13: Share prices and market capitalizat
- Page 14 and 15: E) Share prices and market capitali
- Page 16 and 17: Italcementi S.p.A. Directors, Offic
- Page 18 and 19: Lorenzo Renato Guerini (Director si
- Page 20 and 21: Alberto Clô (Director since May 4,
- Page 22 and 23: Yves René Nanot (Director since Ju
- Page 24 and 25: Board of Statutory Auditors Maria M
- Page 26 and 27: Notice of Call Those who are entitl
- Page 28 and 29: Appointment of the Board of Directo
- Page 31 and 32: Annual Report Consolidated Annual R
- Page 33 and 34: 2012 Annual Report Presentation 4 G
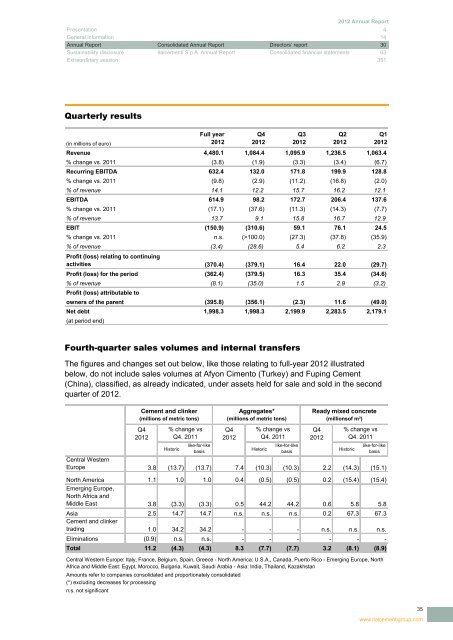
- Page 35: 2012 Annual Report Presentation 4 G
- Page 39 and 40: 2012 Annual Report Presentation 4 G
- Page 41 and 42: 2012 Annual Report Presentation 4 G
- Page 43 and 44: 2012 Annual Report Presentation 4 G
- Page 45 and 46: 2012 Annual Report Presentation 4 G
- Page 47 and 48: 2012 Annual Report Presentation 4 G
- Page 49 and 50: 2012 Annual Report Presentation 4 G
- Page 51 and 52: 2012 Annual Report Presentation 4 G
- Page 53 and 54: 2012 Annual Report Presentation 4 G
- Page 55 and 56: 2012 Annual Report Presentation 4 G
- Page 57 and 58: 2012 Annual Report Presentation 4 G
- Page 59 and 60: 2012 Annual Report Presentation 4 G
- Page 61 and 62: 2012 Annual Report Presentation 4 G
- Page 63: 2012 Annual Report Presentation 4 G
- Page 66 and 67: Financial statements Statement of f
- Page 68 and 69: Statement of comprehensive income N
- Page 70 and 71: Statement of cash flows Notes 2012
- Page 72 and 73: 21. Deferred tax assets and Deferre
- Page 74 and 75: Amendments to IAS 12 “Income taxe
- Page 76 and 77: 1.3. Basis of consolidation The con
- Page 78 and 79: Changes in equity interests in subs
- Page 80 and 81: Operating lease payments are recogn
- Page 82 and 83: 1.15. Cash and cash equivalents Cas
- Page 84 and 85: 1.18. Share-based payments The Grou
- Page 86 and 87:
1.24. Government grants Government
- Page 88 and 89:
4. Operating segment disclosure The
- Page 90 and 91:
The table below sets out segment re
- Page 92 and 93:
The table below sets out other segm
- Page 94 and 95:
The useful life adopted by the Grou
- Page 96 and 97:
Assumptions used for the computatio
- Page 98 and 99:
7. Intangible assets in thousands o
- Page 100 and 101:
10. Other non-current assets This c
- Page 102 and 103:
15. Reserves Translation reserve Th
- Page 104 and 105:
Net liabilities determined on the b
- Page 106 and 107:
The table below sets out key data f
- Page 108 and 109:
appeal and by the regional court of
- Page 110 and 111:
22.1 Financial liabilities Financia
- Page 112 and 113:
Bond loans f) The Italcementi Group
- Page 114 and 115:
The bond was assigned a Ba2 Moody
- Page 116 and 117:
At December 31, 2012 lines of credi
- Page 118 and 119:
22.3.1 Fair value of derivatives Th
- Page 120 and 121:
22.4 Interest-rate risk management
- Page 122 and 123:
The Group companies operate chiefly
- Page 124 and 125:
From 2008 to 2012, the Group transa
- Page 126 and 127:
26. Services Services amounted to 1
- Page 128 and 129:
29. Non-recurring income (expense)
- Page 130 and 131:
The income statement and the statem
- Page 132 and 133:
Diluted earnings per share Diluted
- Page 134 and 135:
36. Joint ventures The Group’s mo
- Page 136 and 137:
Net debt (in thousands of euro) amo
- Page 138 and 139:
Annex 1 The following table shows i
- Page 140 and 141:
Company Registered office Share cap
- Page 142 and 143:
Company Registered office Share cap
- Page 147 and 148:
Italcementi S.p.A. Annual Report 14
- Page 149 and 150:
2012 Annual Report Presentation 4 G
- Page 151 and 152:
2012 Annual Report Presentation 4 G
- Page 153 and 154:
2012 Annual Report Presentation 4 G
- Page 155 and 156:
2012 Annual Report Presentation 4 G
- Page 157 and 158:
2012 Annual Report Presentation 4 G
- Page 159 and 160:
2012 Annual Report Presentation 4 G
- Page 161 and 162:
2012 Annual Report Presentation 4 G
- Page 163 and 164:
2012 Annual Report Presentation 4 G
- Page 165 and 166:
2012 Annual Report Presentation 4 G
- Page 167 and 168:
2012 Annual Report Presentation 4 G
- Page 169 and 170:
2012 Annual Report Presentation 4 G
- Page 171 and 172:
2012 Annual Report Presentation 4 G
- Page 173 and 174:
2012 Annual Report Presentation 4 G
- Page 175 and 176:
2012 Annual Report Presentation 4 G
- Page 177 and 178:
2012 Annual Report Presentation 4 G
- Page 179 and 180:
2012 Annual Report Presentation 4 G
- Page 181 and 182:
2012 Annual Report Presentation 4 G
- Page 183 and 184:
2012 Annual Report Presentation 4 G
- Page 185 and 186:
2012 Annual Report Presentation 4 G
- Page 187 and 188:
2012 Annual Report Presentation 4 G
- Page 189 and 190:
2012 Annual Report Presentation 4 G
- Page 191 and 192:
2012 Annual Report Presentation 4 G
- Page 193 and 194:
2012 Annual Report Presentation 4 G
- Page 195 and 196:
2012 Annual Report Presentation 4 G
- Page 197 and 198:
2012 Annual Report Presentation 4 G
- Page 199 and 200:
2012 Annual Report Presentation 4 G
- Page 201 and 202:
2012 Annual Report Presentation 4 G
- Page 203 and 204:
2012 Annual Report Presentation 4 G
- Page 205 and 206:
2012 Annual Report Presentation 4 G
- Page 207 and 208:
2012 Annual Report Presentation 4 G
- Page 209 and 210:
2012 Annual Report Presentation 4 G
- Page 211 and 212:
2012 Annual Report Presentation 4 G
- Page 213 and 214:
2012 Annual Report Presentation 4 G
- Page 215 and 216:
2012 Annual Report Presentation 4 G
- Page 217 and 218:
2012 Annual Report Presentation 4 G
- Page 219 and 220:
2012 Annual Report Presentation 4 G
- Page 221 and 222:
2012 Annual Report Presentation 4 G
- Page 223 and 224:
2012 Annual Report Presentation 4 G
- Page 225 and 226:
2012 Annual Report Presentation 4 G
- Page 227 and 228:
2012 Annual Report Presentation 4 G
- Page 229 and 230:
2012 Annual Report Presentation 4 G
- Page 231 and 232:
2012 Annual Report Presentation 4 G
- Page 233 and 234:
2012 Annual Report Presentation 4 G
- Page 235 and 236:
2012 Annual Report Presentation 4 G
- Page 237 and 238:
2012 Annual Report Presentation 4 G
- Page 239 and 240:
2012 Annual Report Presentation 4 G
- Page 241 and 242:
2012 Annual Report Presentation 4 G
- Page 243 and 244:
Separated financial statements 241
- Page 245 and 246:
2012 Annual Report Presentation 4 G
- Page 247 and 248:
2012 Annual Report Presentation 4 G
- Page 249 and 250:
2012 Annual Report Presentation 4 G
- Page 251 and 252:
2012 Annual Report Presentation 4 G
- Page 253 and 254:
2012 Annual Report Presentation 4 G
- Page 255 and 256:
2012 Annual Report Presentation 4 G
- Page 257 and 258:
2012 Annual Report Presentation 4 G
- Page 259 and 260:
2012 Annual Report Presentation 4 G
- Page 261 and 262:
2012 Annual Report Presentation 4 G
- Page 263 and 264:
2012 Annual Report Presentation 4 G
- Page 265 and 266:
2012 Annual Report Presentation 4 G
- Page 267 and 268:
2012 Annual Report Presentation 4 G
- Page 269 and 270:
2012 Annual Report Presentation 4 G
- Page 271 and 272:
2012 Annual Report Presentation 4 G
- Page 273 and 274:
2012 Annual Report Presentation 4 G
- Page 275 and 276:
2012 Annual Report Presentation 4 G
- Page 277 and 278:
2012 Annual Report Presentation 4 G
- Page 279 and 280:
2012 Annual Report Presentation 4 G
- Page 281 and 282:
2012 Annual Report Presentation 4 G
- Page 283 and 284:
2012 Annual Report Presentation 4 G
- Page 285 and 286:
2012 Annual Report Presentation 4 G
- Page 287 and 288:
2012 Annual Report Presentation 4 G
- Page 289 and 290:
2012 Annual Report Presentation 4 G
- Page 291 and 292:
2012 Annual Report Presentation 4 G
- Page 293 and 294:
2012 Annual Report Presentation 4 G
- Page 295 and 296:
2012 Annual Report Presentation 4 G
- Page 297 and 298:
2012 Annual Report Presentation 4 G
- Page 299 and 300:
2012 Annual Report Presentation 4 G
- Page 301 and 302:
2012 Annual Report Presentation 4 G
- Page 303 and 304:
2012 Annual Report Presentation 4 G
- Page 305 and 306:
Annexes 303 www.italcementigroup.co
- Page 308 and 309:
ITALCEMENTI S.P.A. REPORT OF THE BO
- Page 310 and 311:
We ascertained that the Remuneratio
- Page 314 and 315:
312
- Page 316 and 317:
Sustainability disclosure Italcemen
- Page 318 and 319:
In 2010, the Group reinforced its a
- Page 320 and 321:
2 Looking forward 2.1 Targets 2015
- Page 322 and 323:
3 Social responsibility 3.1 Valuing
- Page 324 and 325:
2012 2011 2010 2012 2011 2010 Italy
- Page 326 and 327:
Trainees (%) 2012 2011 2010 Manager
- Page 328 and 329:
3.3 Health and product responsibili
- Page 330 and 331:
The Social Initiatives Policy reinf
- Page 332 and 333:
In 2012, Energy Efficiency Certific
- Page 334 and 335:
Power consumption, concrete 2012 20
- Page 336 and 337:
4.3 Air emissions At the end of 201
- Page 338 and 339:
Water consumption, cement 2012 2011
- Page 340 and 341:
Quarry management, cement (*) Matur
- Page 342 and 343:
5.2 Quality The Group is committed
- Page 344 and 345:
5.4 Sustainable construction Italce
- Page 346 and 347:
6 Reporting and additional informat
- Page 349 and 350:
6.4 Boundaries and reporting method
- Page 351 and 352:
Training management system Hours of
- Page 353 and 354:
Extraordinary session 351 www.italc
- Page 355 and 356:
2012 Annual Report Presentation 4 G
- Page 357 and 358:
Summary of resolutions The Annual G
- Page 359 and 360:
at an extraordinary session: to ren
- Page 362:
April 2013 Project by LSVmultimedia