Financial statements Statement of financial position (in thousands of euro) Notes 12.31.<strong>2012</strong> 12.31.2011 Change Non-current assets Property, plant and equipment 5 4,121,089 4,447,322 (326,233) Investment property 5 29,269 23,457 5,812 Goodwill 6 1,598,687 1,919,288 (320,601) Intangible assets 7 97,808 98,083 (275) Equity accounted investees 8 207,488 216,742 (9,254) Other equity investments 9 80,096 88,246 (8,150) Deferred tax assets 21 57,600 76,217 (18,617) Other non-current assets 10 307,521 289,183 18,338 Total non-current assets 6,499,558 7,158,538 (658,980) Current assets Inventories 11 699,720 740,991 (41,271) Trade receivables 12 744,579 857,327 (112,748) Other current assets including derivatives 13 317,949 295,271 22,678 Tax assets 26,638 29,348 (2,710) Equity investments, bonds and financial assets 23,006 36,022 (13,016) Cash and cash equivalents 37.1 578,388 613,334 (34,946) Total current assets 2,390,280 2,572,293 (182,013) Total assets 8,889,838 9,730,831 (840,993) Equity Share capital 14 282,549 282,549 - Share premium 14 344,104 344,104 - Reserves 15 35,541 131,764 (96,223) Treasury shares 16 (58,690) (58,690) - Retained earnings 17 2,363,209 2,795,189 (431,980) Equity attributable to owners of the parent 2,966,713 3,494,916 (528,203) Non-controlling interests 18 1,273,134 1,399,975 (126,841) Total equity 4,239,847 4,894,891 (655,044) Non-current liabilities Financial liabilities 22 2,016,946 2,099,268 (82,322) Employee benefits 19 232,821 202,955 29,866 Provisions 20 225,435 248,790 (23,355) Deferred tax liabilities 21 209,215 222,086 (12,871) Other non-current liabilities 40,529 29,788 10,741 Total non-current liabilities 2,724,946 2,802,887 (77,941) Current liabilities Loans and borrowings 22 429,479 189,296 240,183 Financial liabilities 22 296,376 543,934 (247,558) Trade payables 605,629 618,343 (12,714) Provisions 20 559 1,993 (1,434) Tax liabilities 30,884 42,299 (11,415) Other current liabilities 23 562,118 637,188 (75,070) Total current liabilities 1,925,045 2,033,053 (108,008) Total liabilities 4,649,991 4,835,940 (185,949) Total equity and liabilities 8,889,838 9,730,831 (840,993) 64
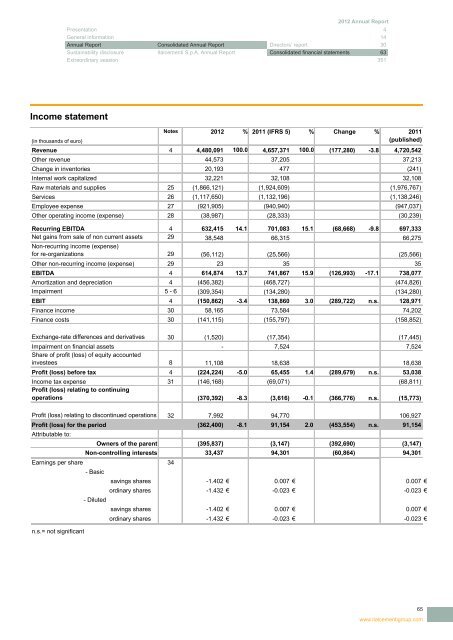
<strong>2012</strong> <strong>Annual</strong> <strong>Report</strong> Presentation 4 General information 14 <strong>Annual</strong> <strong>Report</strong> Consolidated <strong>Annual</strong> <strong>Report</strong> Directors’ report 30 Sustainability disclosure <strong>Italcementi</strong> S.p.A. <strong>Annual</strong> <strong>Report</strong> Consolidated financial statements 63 Extraordinary session 351 Income statement Notes <strong>2012</strong> % 2011 (IFRS 5) % Change % 2011 (in thousands of euro) (published) Revenue 4 4,480,091 100.0 4,657,371 100.0 (177,280) -3.8 4,720,542 Other revenue 44,573 37,205 37,213 Change in inventories 20,193 477 (241) Internal work capitalized 32,221 32,108 32,108 Raw materials and supplies 25 (1,866,121) (1,924,609) (1,976,767) Services 26 (1,117,650) (1,132,196) (1,138,246) Employee expense 27 (921,905) (940,940) (947,037) Other operating income (expense) 28 (38,987) (28,333) (30,239) Recurring EBITDA 4 632,415 14.1 701,083 15.1 (68,668) -9.8 697,333 Net gains from sale of non current assets 29 38,548 66,315 66,275 Non-recurring income (expense) for re-organizations 29 (56,112) (25,566) (25,566) Other non-recurring income (expense) 29 23 35 35 EBITDA 4 614,874 13.7 741,867 15.9 (126,993) -17.1 738,077 Amortization and depreciation 4 (456,382) (468,727) (474,826) Impairment 5 - 6 (309,354) (134,280) (134,280) EBIT 4 (150,862) -3.4 138,860 3.0 (289,722) n.s. 128,971 Finance income 30 58,165 73,584 74,202 Finance costs 30 (141,115) (155,797) (158,852) Exchange-rate differences and derivatives 30 (1,520) (17,354) (17,445) Impairment on financial assets - 7,524 7,524 Share of profit (loss) of equity accounted investees 8 11,108 18,638 18,638 Profit (loss) before tax 4 (224,224) -5.0 65,455 1.4 (289,679) n.s. 53,038 Income tax expense 31 (146,168) (69,071) (68,811) Profit (loss) relating to continuing operations (370,392) -8.3 (3,616) -0.1 (366,776) n.s. (15,773) Profit (loss) relating to discontinued operations 32 7,992 94,770 106,927 Profit (loss) for the period (362,400) -8.1 91,154 2.0 (453,554) n.s. 91,154 Attributable to: Owners of the parent (395,837) (3,147) (392,690) ###### (3,147) Non-controlling interests 33,437 94,301 (60,864) -64.5 94,301 Earnings per share 34 - Basic savings shares -1.402 € 0.007 € 0.007 € ordinary shares -1.432 € -0.023 € -0.023 € - Diluted savings shares -1.402 € 0.007 € 0.007 € ordinary shares -1.432 € -0.023 € -0.023 € n.s.= not significant 65 www.italcementigroup.com
- Page 1:
2012 Annual Report
- Page 4 and 5:
Contents PRESENTATION Letter to the
- Page 6 and 7:
Letter to the stakeholders Consolid
- Page 8 and 9:
Italcementi Group in the world (as
- Page 10 and 11:
Highlights Contribution to consolid
- Page 12 and 13:
Share prices and market capitalizat
- Page 14 and 15:
E) Share prices and market capitali
- Page 16 and 17: Italcementi S.p.A. Directors, Offic
- Page 18 and 19: Lorenzo Renato Guerini (Director si
- Page 20 and 21: Alberto Clô (Director since May 4,
- Page 22 and 23: Yves René Nanot (Director since Ju
- Page 24 and 25: Board of Statutory Auditors Maria M
- Page 26 and 27: Notice of Call Those who are entitl
- Page 28 and 29: Appointment of the Board of Directo
- Page 31 and 32: Annual Report Consolidated Annual R
- Page 33 and 34: 2012 Annual Report Presentation 4 G
- Page 35 and 36: 2012 Annual Report Presentation 4 G
- Page 37 and 38: 2012 Annual Report Presentation 4 G
- Page 39 and 40: 2012 Annual Report Presentation 4 G
- Page 41 and 42: 2012 Annual Report Presentation 4 G
- Page 43 and 44: 2012 Annual Report Presentation 4 G
- Page 45 and 46: 2012 Annual Report Presentation 4 G
- Page 47 and 48: 2012 Annual Report Presentation 4 G
- Page 49 and 50: 2012 Annual Report Presentation 4 G
- Page 51 and 52: 2012 Annual Report Presentation 4 G
- Page 53 and 54: 2012 Annual Report Presentation 4 G
- Page 55 and 56: 2012 Annual Report Presentation 4 G
- Page 57 and 58: 2012 Annual Report Presentation 4 G
- Page 59 and 60: 2012 Annual Report Presentation 4 G
- Page 61 and 62: 2012 Annual Report Presentation 4 G
- Page 63: 2012 Annual Report Presentation 4 G
- Page 68 and 69: Statement of comprehensive income N
- Page 70 and 71: Statement of cash flows Notes 2012
- Page 72 and 73: 21. Deferred tax assets and Deferre
- Page 74 and 75: Amendments to IAS 12 “Income taxe
- Page 76 and 77: 1.3. Basis of consolidation The con
- Page 78 and 79: Changes in equity interests in subs
- Page 80 and 81: Operating lease payments are recogn
- Page 82 and 83: 1.15. Cash and cash equivalents Cas
- Page 84 and 85: 1.18. Share-based payments The Grou
- Page 86 and 87: 1.24. Government grants Government
- Page 88 and 89: 4. Operating segment disclosure The
- Page 90 and 91: The table below sets out segment re
- Page 92 and 93: The table below sets out other segm
- Page 94 and 95: The useful life adopted by the Grou
- Page 96 and 97: Assumptions used for the computatio
- Page 98 and 99: 7. Intangible assets in thousands o
- Page 100 and 101: 10. Other non-current assets This c
- Page 102 and 103: 15. Reserves Translation reserve Th
- Page 104 and 105: Net liabilities determined on the b
- Page 106 and 107: The table below sets out key data f
- Page 108 and 109: appeal and by the regional court of
- Page 110 and 111: 22.1 Financial liabilities Financia
- Page 112 and 113: Bond loans f) The Italcementi Group
- Page 114 and 115: The bond was assigned a Ba2 Moody
- Page 116 and 117:
At December 31, 2012 lines of credi
- Page 118 and 119:
22.3.1 Fair value of derivatives Th
- Page 120 and 121:
22.4 Interest-rate risk management
- Page 122 and 123:
The Group companies operate chiefly
- Page 124 and 125:
From 2008 to 2012, the Group transa
- Page 126 and 127:
26. Services Services amounted to 1
- Page 128 and 129:
29. Non-recurring income (expense)
- Page 130 and 131:
The income statement and the statem
- Page 132 and 133:
Diluted earnings per share Diluted
- Page 134 and 135:
36. Joint ventures The Group’s mo
- Page 136 and 137:
Net debt (in thousands of euro) amo
- Page 138 and 139:
Annex 1 The following table shows i
- Page 140 and 141:
Company Registered office Share cap
- Page 142 and 143:
Company Registered office Share cap
- Page 147 and 148:
Italcementi S.p.A. Annual Report 14
- Page 149 and 150:
2012 Annual Report Presentation 4 G
- Page 151 and 152:
2012 Annual Report Presentation 4 G
- Page 153 and 154:
2012 Annual Report Presentation 4 G
- Page 155 and 156:
2012 Annual Report Presentation 4 G
- Page 157 and 158:
2012 Annual Report Presentation 4 G
- Page 159 and 160:
2012 Annual Report Presentation 4 G
- Page 161 and 162:
2012 Annual Report Presentation 4 G
- Page 163 and 164:
2012 Annual Report Presentation 4 G
- Page 165 and 166:
2012 Annual Report Presentation 4 G
- Page 167 and 168:
2012 Annual Report Presentation 4 G
- Page 169 and 170:
2012 Annual Report Presentation 4 G
- Page 171 and 172:
2012 Annual Report Presentation 4 G
- Page 173 and 174:
2012 Annual Report Presentation 4 G
- Page 175 and 176:
2012 Annual Report Presentation 4 G
- Page 177 and 178:
2012 Annual Report Presentation 4 G
- Page 179 and 180:
2012 Annual Report Presentation 4 G
- Page 181 and 182:
2012 Annual Report Presentation 4 G
- Page 183 and 184:
2012 Annual Report Presentation 4 G
- Page 185 and 186:
2012 Annual Report Presentation 4 G
- Page 187 and 188:
2012 Annual Report Presentation 4 G
- Page 189 and 190:
2012 Annual Report Presentation 4 G
- Page 191 and 192:
2012 Annual Report Presentation 4 G
- Page 193 and 194:
2012 Annual Report Presentation 4 G
- Page 195 and 196:
2012 Annual Report Presentation 4 G
- Page 197 and 198:
2012 Annual Report Presentation 4 G
- Page 199 and 200:
2012 Annual Report Presentation 4 G
- Page 201 and 202:
2012 Annual Report Presentation 4 G
- Page 203 and 204:
2012 Annual Report Presentation 4 G
- Page 205 and 206:
2012 Annual Report Presentation 4 G
- Page 207 and 208:
2012 Annual Report Presentation 4 G
- Page 209 and 210:
2012 Annual Report Presentation 4 G
- Page 211 and 212:
2012 Annual Report Presentation 4 G
- Page 213 and 214:
2012 Annual Report Presentation 4 G
- Page 215 and 216:
2012 Annual Report Presentation 4 G
- Page 217 and 218:
2012 Annual Report Presentation 4 G
- Page 219 and 220:
2012 Annual Report Presentation 4 G
- Page 221 and 222:
2012 Annual Report Presentation 4 G
- Page 223 and 224:
2012 Annual Report Presentation 4 G
- Page 225 and 226:
2012 Annual Report Presentation 4 G
- Page 227 and 228:
2012 Annual Report Presentation 4 G
- Page 229 and 230:
2012 Annual Report Presentation 4 G
- Page 231 and 232:
2012 Annual Report Presentation 4 G
- Page 233 and 234:
2012 Annual Report Presentation 4 G
- Page 235 and 236:
2012 Annual Report Presentation 4 G
- Page 237 and 238:
2012 Annual Report Presentation 4 G
- Page 239 and 240:
2012 Annual Report Presentation 4 G
- Page 241 and 242:
2012 Annual Report Presentation 4 G
- Page 243 and 244:
Separated financial statements 241
- Page 245 and 246:
2012 Annual Report Presentation 4 G
- Page 247 and 248:
2012 Annual Report Presentation 4 G
- Page 249 and 250:
2012 Annual Report Presentation 4 G
- Page 251 and 252:
2012 Annual Report Presentation 4 G
- Page 253 and 254:
2012 Annual Report Presentation 4 G
- Page 255 and 256:
2012 Annual Report Presentation 4 G
- Page 257 and 258:
2012 Annual Report Presentation 4 G
- Page 259 and 260:
2012 Annual Report Presentation 4 G
- Page 261 and 262:
2012 Annual Report Presentation 4 G
- Page 263 and 264:
2012 Annual Report Presentation 4 G
- Page 265 and 266:
2012 Annual Report Presentation 4 G
- Page 267 and 268:
2012 Annual Report Presentation 4 G
- Page 269 and 270:
2012 Annual Report Presentation 4 G
- Page 271 and 272:
2012 Annual Report Presentation 4 G
- Page 273 and 274:
2012 Annual Report Presentation 4 G
- Page 275 and 276:
2012 Annual Report Presentation 4 G
- Page 277 and 278:
2012 Annual Report Presentation 4 G
- Page 279 and 280:
2012 Annual Report Presentation 4 G
- Page 281 and 282:
2012 Annual Report Presentation 4 G
- Page 283 and 284:
2012 Annual Report Presentation 4 G
- Page 285 and 286:
2012 Annual Report Presentation 4 G
- Page 287 and 288:
2012 Annual Report Presentation 4 G
- Page 289 and 290:
2012 Annual Report Presentation 4 G
- Page 291 and 292:
2012 Annual Report Presentation 4 G
- Page 293 and 294:
2012 Annual Report Presentation 4 G
- Page 295 and 296:
2012 Annual Report Presentation 4 G
- Page 297 and 298:
2012 Annual Report Presentation 4 G
- Page 299 and 300:
2012 Annual Report Presentation 4 G
- Page 301 and 302:
2012 Annual Report Presentation 4 G
- Page 303 and 304:
2012 Annual Report Presentation 4 G
- Page 305 and 306:
Annexes 303 www.italcementigroup.co
- Page 308 and 309:
ITALCEMENTI S.P.A. REPORT OF THE BO
- Page 310 and 311:
We ascertained that the Remuneratio
- Page 314 and 315:
312
- Page 316 and 317:
Sustainability disclosure Italcemen
- Page 318 and 319:
In 2010, the Group reinforced its a
- Page 320 and 321:
2 Looking forward 2.1 Targets 2015
- Page 322 and 323:
3 Social responsibility 3.1 Valuing
- Page 324 and 325:
2012 2011 2010 2012 2011 2010 Italy
- Page 326 and 327:
Trainees (%) 2012 2011 2010 Manager
- Page 328 and 329:
3.3 Health and product responsibili
- Page 330 and 331:
The Social Initiatives Policy reinf
- Page 332 and 333:
In 2012, Energy Efficiency Certific
- Page 334 and 335:
Power consumption, concrete 2012 20
- Page 336 and 337:
4.3 Air emissions At the end of 201
- Page 338 and 339:
Water consumption, cement 2012 2011
- Page 340 and 341:
Quarry management, cement (*) Matur
- Page 342 and 343:
5.2 Quality The Group is committed
- Page 344 and 345:
5.4 Sustainable construction Italce
- Page 346 and 347:
6 Reporting and additional informat
- Page 349 and 350:
6.4 Boundaries and reporting method
- Page 351 and 352:
Training management system Hours of
- Page 353 and 354:
Extraordinary session 351 www.italc
- Page 355 and 356:
2012 Annual Report Presentation 4 G
- Page 357 and 358:
Summary of resolutions The Annual G
- Page 359 and 360:
at an extraordinary session: to ren
- Page 362:
April 2013 Project by LSVmultimedia