

COMPLETE DOCUMENT (1862 kb) - OECD Nuclear Energy Agency
COMPLETE DOCUMENT (1862 kb) - OECD Nuclear Energy Agency
COMPLETE DOCUMENT (1862 kb) - OECD Nuclear Energy Agency

You also want an ePaper? Increase the reach of your titles
YUMPU automatically turns print PDFs into web optimized ePapers that Google loves.
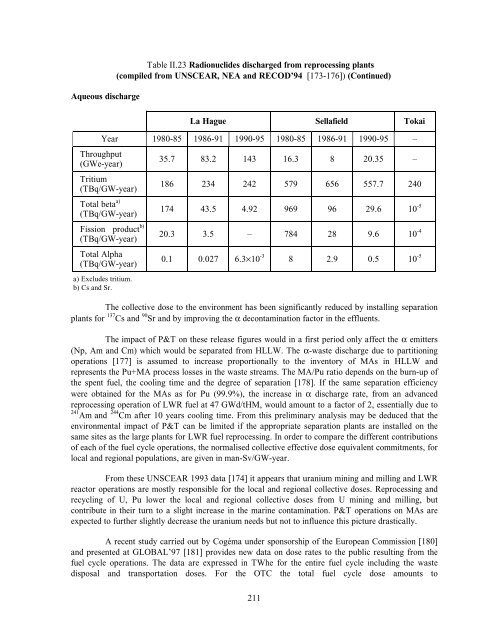
Aqueous discharge<br />
Table II.23 Radionuclides discharged from reprocessing plants<br />
(compiled from UNSCEAR, NEA and RECOD’94 [173-176]) (Continued)<br />
Throughput<br />
(GWe-year)<br />
La Hague Sellafield Tokai<br />
Year 1980-85 1986-91 1990-95 1980-85 1986-91 1990-95 –<br />
Tritium<br />
(TBq/GW-year)<br />
Total beta a)<br />
(TBq/GW-year)<br />
Fission product b)<br />
(TBq/GW-year)<br />
Total Alpha<br />
(TBq/GW-year)<br />
a) Excludes tritium.<br />
b) Cs and Sr.<br />
35.7 83.2 143 16.3 8 20.35 –<br />
186 234 242 579 656 557.7 240<br />
174 43.5 4.92 969 96 29.6 10 -5<br />
20.3 3.5 – 784 28 9.6 10 -4<br />
0.1 0.027 6.3×10 -3 8 2.9 0.5 10 -5<br />
The collective dose to the environment has been significantly reduced by installing separation<br />
plants for 137 Cs and 90 Sr and by improving the α decontamination factor in the effluents.<br />
The impact of P&T on these release figures would in a first period only affect the α emitters<br />
(Np, Am and Cm) which would be separated from HLLW. The α-waste discharge due to partitioning<br />
operations [177] is assumed to increase proportionally to the inventory of MAs in HLLW and<br />
represents the Pu+MA process losses in the waste streams. The MA/Pu ratio depends on the burn-up of<br />
the spent fuel, the cooling time and the degree of separation [178]. If the same separation efficiency<br />
were obtained for the MAs as for Pu (99.9%), the increase in α discharge rate, from an advanced<br />
reprocessing operation of LWR fuel at 47 GWd/tHM, would amount to a factor of 2, essentially due to<br />
241 Am and 244 Cm after 10 years cooling time. From this preliminary analysis may be deduced that the<br />
environmental impact of P&T can be limited if the appropriate separation plants are installed on the<br />
same sites as the large plants for LWR fuel reprocessing. In order to compare the different contributions<br />
of each of the fuel cycle operations, the normalised collective effective dose equivalent commitments, for<br />
local and regional populations, are given in man-Sv/GW-year.<br />
From these UNSCEAR 1993 data [174] it appears that uranium mining and milling and LWR<br />
reactor operations are mostly responsible for the local and regional collective doses. Reprocessing and<br />
recycling of U, Pu lower the local and regional collective doses from U mining and milling, but<br />
contribute in their turn to a slight increase in the marine contamination. P&T operations on MAs are<br />
expected to further slightly decrease the uranium needs but not to influence this picture drastically.<br />
A recent study carried out by Cogéma under sponsorship of the European Commission [180]<br />
and presented at GLOBAL’97 [181] provides new data on dose rates to the public resulting from the<br />
fuel cycle operations. The data are expressed in TWhe for the entire fuel cycle including the waste<br />
disposal and transportation doses. For the OTC the total fuel cycle dose amounts to<br />
211


