

Bridging the Gap: linking timber trade with infrastructural ...
Bridging the Gap: linking timber trade with infrastructural ...
Bridging the Gap: linking timber trade with infrastructural ...

You also want an ePaper? Increase the reach of your titles
YUMPU automatically turns print PDFs into web optimized ePapers that Google loves.
ound wood from <strong>the</strong> study area. Over <strong>the</strong> same period, an estimated 42 000 m 3 <strong>timber</strong> was transported<br />
north over <strong>the</strong> Rufiji River, and 2420 m 3 shipped from <strong>the</strong> ports of Mtwara, Lindi and Kilwa Masoko.<br />
This does not include informal shipments by sea, charcoal and construction <strong>timber</strong> sold in urban markets<br />
<strong>with</strong>in <strong>the</strong> country, nor vast quantities of wood fuel (approximately 2.1 million m 3 ) and o<strong>the</strong>r forest<br />
products used by individual households.<br />
Estimated harvest pressure by district<br />
If <strong>the</strong> forest areas of each district are taken into account, an<br />
estimated average harvest pressure may be calculated for each<br />
district, <strong>with</strong> <strong>the</strong> assumption that average forest stocking<br />
densities are <strong>the</strong> same for each district and all areas of forest<br />
are harvestable (Table 14). As expected, this analysis shows<br />
that Rufiji District has by far <strong>the</strong> highest estimated harvest<br />
pressure, a factor of almost five times higher than Kilwa<br />
District and 50 times higher than Liwale District, highlighting<br />
<strong>the</strong> immediate need for harvest plans.<br />
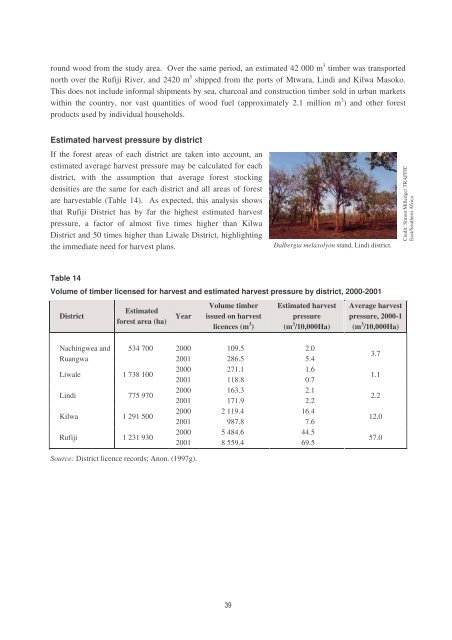
Dalbergia melaxolyon stand, Lindi district.<br />
Credit: Simon Milledge/ TRAFFIC<br />
East/Sou<strong>the</strong>rn Africa<br />
Table 14<br />
Volume of <strong>timber</strong> licensed for harvest and estimated harvest pressure by district, 2000-2001<br />
District<br />
Estimated<br />
forest area (ha)<br />
Year<br />
Volume <strong>timber</strong><br />
issued on harvest<br />
licences (m 3 )<br />
Estimated harvest<br />
pressure<br />
(m 3 /10,000Ha)<br />
Average harvest<br />
pressure, 2000-1<br />
(m 3 /10,000Ha)<br />
Nachingwea and<br />
Ruangwa<br />
534 700<br />
Liwale 1 738 100<br />
Lindi 775 970<br />
Kilwa 1 291 500<br />
Rufiji 1 231 930<br />
2000 109.5 2.0<br />
2001 286.5 5.4<br />
2000 271.1 1.6<br />
2001 118.8 0.7<br />
2000 163.3 2.1<br />
2001 171.9 2.2<br />
2000 2 119.4 16.4<br />
2001 987.8 7.6<br />
2000 5 484.6 44.5<br />
2001 8 559.4 69.5<br />
3.7<br />
1.1<br />
2.2<br />
12.0<br />
57.0<br />
Source: District licence records; Anon. (1997g).<br />
39


