

Bridging the Gap: linking timber trade with infrastructural ...
Bridging the Gap: linking timber trade with infrastructural ...
Bridging the Gap: linking timber trade with infrastructural ...

You also want an ePaper? Increase the reach of your titles
YUMPU automatically turns print PDFs into web optimized ePapers that Google loves.
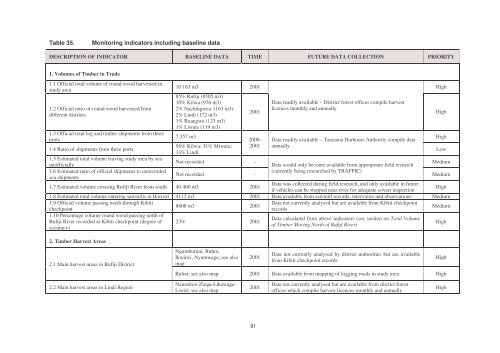
Table 35.<br />
Monitoring indicators including baseline data<br />
DESCRIPTION OF INDICATOR BASELINE DATA TIME FUTURE DATA COLLECTION PRIORITY<br />
1. Volumes of Timber in Trade<br />
1.1 Official total volume of round wood harvested in<br />
study area<br />
1.2 Official ratio of round wood harvested from<br />
different districts<br />
1.3 Official total log and <strong>timber</strong> shipments from three<br />
ports<br />
1.4 Ratio of shipments from three ports<br />
10 163 m3 2001 High<br />
85% Rufiji (8505 m3)<br />
10% Kilwa (976 m3)<br />
2% Nachingwea (163 m3)<br />
2% Lindi (172 m3)<br />
1% Ruangwa (123 m3)<br />
1% Liwale (119 m3)<br />
2001<br />
Data readily available – District forest offices compile harvest<br />
licences monthly and annually<br />
7,357 m3 High<br />
2000- Data readily available – Tanzania Harbours Authority compile data<br />
56% Kilwa: 31% Mtwara: 2001 annually<br />
Low<br />
13% Lindi<br />
1.5 Estimated total volume leaving study area by sea<br />
Not recorded -<br />
unofficially<br />
Data would only become available from appropriate field research<br />
Medium<br />
1.6 Estimated ratio of official shipments to unrecorded<br />
(currently being researched by TRAFFIC)<br />
Not recorded -<br />
sea shipments<br />
Medium<br />
1.7 Estimated volume crossing Rufiji River from south 40 400 m3 2001<br />
Data was collected during field research, and only available in future<br />
if vehicles can be stopped near river for adequate covert inspection<br />
High<br />
1.8 Estimated total volume entering sawmills in Ikwiriri 4112 m3 2001 Data available from sawmill records, interviews and observations Medium<br />
1.9 Official volume passing north through Kibiti<br />
Data not currently analysed but are available from Kibiti checkpoint<br />
8608 m3 2001<br />
checkpoint<br />
records<br />
Medium<br />
1.10 Percentage volume round wood passing north of<br />
Data calculated from above indicators (see section on Total Volume<br />
Rufiji River recorded at Kibiti checkpoint (degree of 23% 2001<br />
of Timber Moving North of Rufiji River)<br />
accuracy)<br />
High<br />
2. Timber Harvest Areas<br />
High<br />
2.1 Main harvest areas in Rufiji District<br />
Ngumburuni, Ruhoi,<br />
Ikwiriri, Nyamwage; see also<br />
map<br />
2001<br />
Data not currently analysed by district authorities but are available<br />
from Kibiti checkpoint records<br />
Ruhoi; see also map 2001 Data available from mapping of logging roads in study area High<br />
High<br />
2.2 Main harvest areas in Lindi Region<br />
Nainokwe-Zinga-Likawage-<br />
Liwiti; see also map<br />
2001<br />
Data not currently analysed but are available from district forest<br />
offices which compile harvest licences monthly and annually<br />
High<br />
91


