Notes to the group annual financial statements // continued for the year ended September <strong>2008</strong> 3. Segment information For management purposes, the group has two <strong>report</strong>ing segments which operate as separate business units: <strong>Sappi</strong> Fine Paper and <strong>Sappi</strong> Forest Products. These divisions are the basis on which the group <strong>report</strong>s its primary segment information. <strong>Sappi</strong> Fine Paper produces coated and uncoated fine paper and speciality paper grades. <strong>Sappi</strong> Forest Products produces commodity paper products, pulp, forest and timber products. The secondary segments have been determined by the geographical location of the production facilities: North America, Europe and Southern Africa. The accounting policies of the segments are the same as those described in the summary of significant accounting policies (refer note 2.2). The group accounts for intragroup sales and transfers as if the sales or transfers were to third parties, that is, at current market prices. All such sales and transfers are eliminated on consolidation. <strong>Sappi</strong> Fine Paper <strong>Sappi</strong> Forest Products US$ million <strong>2008</strong> 2007 2006 <strong>2008</strong> 2007 2006 External sales (1) 4,764 4,256 3,958 1,099 1,048 983 Inter-segment sales 677 602 504 657 658 517 Total sales 5,441 4,858 4,462 1,756 1,706 1,500 Segment result (2) 34 119 (49) 273 264 175 Share of profit (loss) of equity investments 2 3 1 5 3 (1) Depreciation 300 298 321 73 75 68 Amortisation and fellings – 1 2 80 70 74 Asset impairments 82 2 6 37 – 3 Asset impairment reversals – – – – – (40) Other non-cash expenses (including fair value adjustment on plantations) 151 (11) 62 (150) (117) (131) Capital expenditures 216 158 203 290 299 99 Total assets (6) 3,724 3,931 3,810 2,049 2,096 1,419 Operating assets (3)(6) 3,678 3,836 3,726 1,972 1,984 1,407 Operating liabilities (4) 706 682 639 241 251 178 Net operating assets (5)(6) 2,955 3,121 3,049 1,721 1,654 1,188 Property, plant and equipment 2,353 2,503 2,478 1,008 988 669 <strong>Sappi</strong> Fine Paper North America Europe Southern Africa US$ million <strong>2008</strong> 2007 2006 <strong>2008</strong> 2007 2006 <strong>2008</strong> 2007 2006 Sales (1) 1,664 1,511 1,439 2,720 2,387 2,194 380 358 325 Segment result (2) 92 22 (16) (64) 88 (27) 6 9 (6) Capital expenditures 125 44 48 82 102 136 9 12 19 Operating assets (3) 1,285 1,263 1,334 2,226 2,371 2,196 167 202 196 Net operating assets (5) 1,087 1,031 1,108 1,758 1,941 1,796 110 149 145 Property, plant and equipment 879 864 926 1,363 1,502 1,428 111 137 124 100
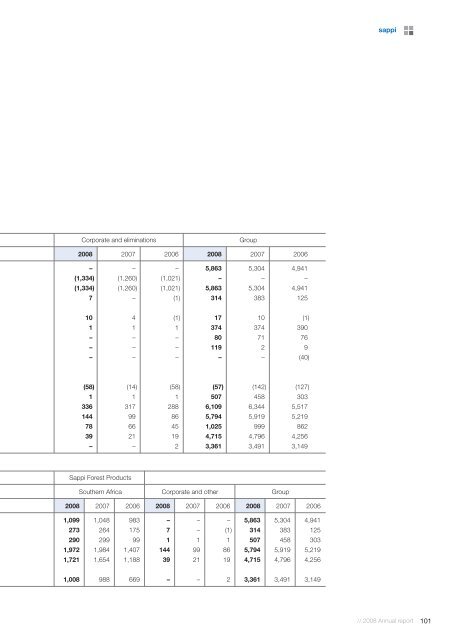
sappi // Corporate and eliminations Group <strong>2008</strong> 2007 2006 <strong>2008</strong> 2007 2006 – – – 5,863 5,304 4,941 (1,334) (1,260) (1,021) – – – (1,334) (1,260) (1,021) 5,863 5,304 4,941 7 – (1) 314 383 125 10 4 (1) 17 10 (1) 1 1 1 374 374 390 – – – 80 71 76 – – – 119 2 9 – – – – – (40) (58) (14) (58) (57) (142) (127) 1 1 1 507 458 303 336 317 288 6,109 6,344 5,517 144 99 86 5,794 5,919 5,219 78 66 45 1,025 999 862 39 21 19 4,715 4,796 4,256 – – 2 3,361 3,491 3,149 <strong>Sappi</strong> Forest Products Southern Africa Corporate and other Group <strong>2008</strong> 2007 2006 <strong>2008</strong> 2007 2006 <strong>2008</strong> 2007 2006 1,099 1,048 983 – – – 5,863 5,304 4,941 273 264 175 7 – (1) 314 383 125 290 299 99 1 1 1 507 458 303 1,972 1,984 1,407 144 99 86 5,794 5,919 5,219 1,721 1,654 1,188 39 21 19 4,715 4,796 4,256 1,008 988 669 – – 2 3,361 3,491 3,149 // <strong>2008</strong> <strong>Annual</strong> <strong>report</strong> 101