

2008 Annual report - Sappi
2008 Annual report - Sappi
2008 Annual report - Sappi

You also want an ePaper? Increase the reach of your titles
YUMPU automatically turns print PDFs into web optimized ePapers that Google loves.
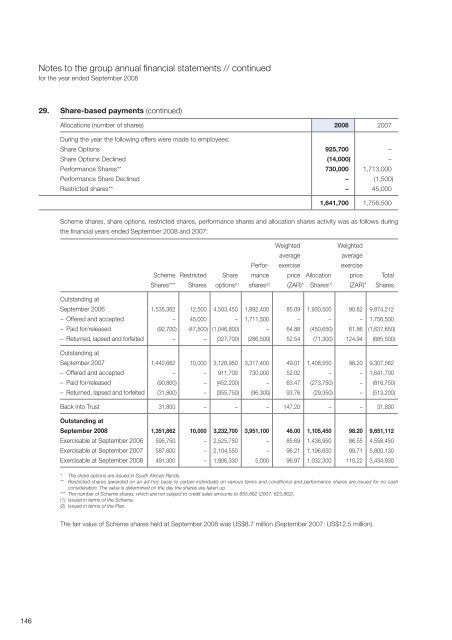
Notes to the group annual financial statements // continued<br />
for the year ended September <strong>2008</strong><br />
29. Share-based payments (continued)<br />
Allocations (number of shares) <strong>2008</strong> 2007<br />
During the year the following offers were made to employees:<br />
Share Options 925,700 –<br />
Share Options Declined (14,000) –<br />
Performance Shares** 730,000 1,713,000<br />
Performance Share Declined – (1,500)<br />
Restricted shares** – 45,000<br />
1,641,700 1,756,500<br />
Scheme shares, share options, restricted shares, performance shares and allocation shares activity was as follows during<br />
the financial years ended September <strong>2008</strong> and 2007:<br />
Weighted<br />
Weighted<br />
average<br />
average<br />
Perfor- exercise exercise<br />
Scheme Restricted Share mance price Allocation price Total<br />
Shares*** Shares options (1) shares (2) (ZAR)* Shares (1) (ZAR)* Shares<br />
Outstanding at<br />
September 2006 1,535,362 12,500 4,503,450 1,892,400 85.09 1,930,500 90.82 9,874,212<br />
– Offered and accepted – 45,000 – 1,711,500 – – – 1,756,500<br />
– Paid for/released (92,700) (47,500) (1,046,800) – 64.88 (450,650) 61.86 (1,637,650)<br />
– Returned, lapsed and forfeited – – (327,700) (286,500) 52.54 (71,300) 124.94 (685,500)<br />
Outstanding at<br />
September 2007 1,442,662 10,000 3,128,950 3,317,400 49.01 1,408,550 98.20 9,307,562<br />
– Offered and accepted – – 911,700 730,000 52.02 – – 1,641,700<br />
– Paid for/released (90,800) – (452,200) – 63.47 (273,750) – (816,750)<br />
– Returned, lapsed and forfeited (31,800) – (355,750) (96,300) 93.76 (29,350) – (513,200)<br />
Back into Trust 31,800 – – – 147.20 – – 31,800<br />
Outstanding at<br />
September <strong>2008</strong> 1,351,862 10,000 3,232,700 3,951,100 46.00 1,105,450 98.20 9,651,112<br />
Exercisable at September 2006 595,750 – 2,525,750 – 85.69 1,436,950 86.55 4,558,450<br />
Exercisable at September 2007 587,600 – 2,104,550 – 96.21 1,196,650 99.71 5,800,130<br />
Exercisable at September <strong>2008</strong> 491,300 – 1,906,330 5,000 96.97 1,032,300 110.22 3,434,930<br />
* The share options are issued in South African Rands.<br />
** Restricted shares (awarded on an ad-hoc basis to certain individuals on various terms and conditions) and performance shares are issued for no cash<br />
consideration. The value is determined on the day the shares are taken up.<br />
*** The number of Scheme shares, which are not subject to credit sales amounts to 855,662 (2007: 823,862).<br />
(1) Issued in terms of the Scheme.<br />
(2) Issued in terms of the Plan.<br />
The fair value of Scheme shares held at September <strong>2008</strong> was US$8.7 million (September 2007: US$12.5 million).<br />
146


