2008 Annual report - Sappi
2008 Annual report - Sappi
2008 Annual report - Sappi
You also want an ePaper? Increase the reach of your titles
YUMPU automatically turns print PDFs into web optimized ePapers that Google loves.
Chief financial officer’s <strong>report</strong> // continued<br />
The largest increases were experienced in Europe (17%) and<br />
Forest Products (17%) with the increases for North America<br />
and Fine Paper South Africa being 6% and 9% respectively.<br />
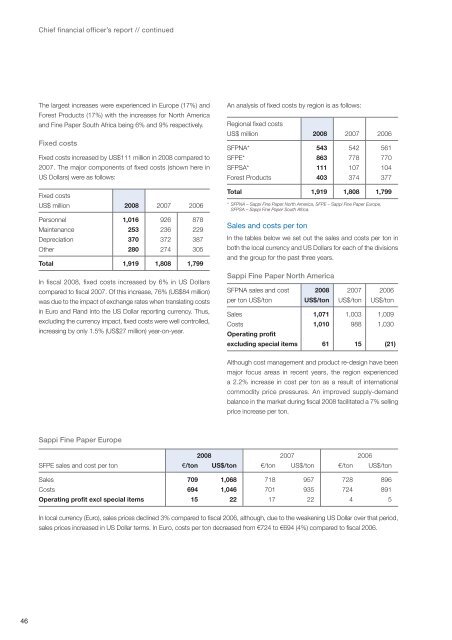
Fixed costs<br />
Fixed costs increased by US$111 million in <strong>2008</strong> compared to<br />
2007. The major components of fixed costs (shown here in<br />
US Dollars) were as follows:<br />
Fixed costs<br />
US$ million <strong>2008</strong> 2007 2006<br />
Personnel 1,016 926 878<br />
Maintenance 253 236 229<br />
Depreciation 370 372 387<br />
Other 280 274 305<br />
Total 1,919 1,808 1,799<br />
In fiscal <strong>2008</strong>, fixed costs increased by 6% in US Dollars<br />
compared to fiscal 2007. Of this increase, 76% (US$84 million)<br />
was due to the impact of exchange rates when translating costs<br />
in Euro and Rand into the US Dollar <strong>report</strong>ing currency. Thus,<br />
excluding the currency impact, fixed costs were well controlled,<br />
increasing by only 1.5% (US$27 million) year-on-year.<br />
An analysis of fixed costs by region is as follows:<br />
Regional fixed costs<br />
US$ million <strong>2008</strong> 2007 2006<br />
SFPNA* 543 542 561<br />
SFPE* 863 778 770<br />
SFPSA* 111 107 104<br />
Forest Products 403 374 377<br />
Total 1,919 1,808 1,799<br />
* SFPNA – <strong>Sappi</strong> Fine Paper North America, SFPE – <strong>Sappi</strong> Fine Paper Europe,<br />
SFPSA – <strong>Sappi</strong> Fine Paper South Africa.<br />
Sales and costs per ton<br />
In the tables below we set out the sales and costs per ton in<br />
both the local currency and US Dollars for each of the divisions<br />
and the group for the past three years.<br />
<strong>Sappi</strong> Fine Paper North America<br />
SFPNA sales and cost <strong>2008</strong> 2007 2006<br />
per ton US$/ton US$/ton US$/ton US$/ton<br />
Sales 1,071 1,003 1,009<br />
Costs 1,010 988 1,030<br />
Operating profit<br />
excluding special items 61 15 (21)<br />
Although cost management and product re-design have been<br />
major focus areas in recent years, the region experienced<br />
a 2.2% increase in cost per ton as a result of international<br />
commodity price pressures. An improved supply-demand<br />
balance in the market during fiscal <strong>2008</strong> facilitated a 7% selling<br />
price increase per ton.<br />
<strong>Sappi</strong> Fine Paper Europe<br />
<strong>2008</strong> 2007 2006<br />
SFPE sales and cost per ton €/ton US$/ton €/ton US$/ton €/ton US$/ton<br />
Sales 709 1,068 718 957 728 896<br />
Costs 694 1,046 701 935 724 891<br />
Operating profit excl special items 15 22 17 22 4 5<br />
In local currency (Euro), sales prices declined 3% compared to fiscal 2006, although, due to the weakening US Dollar over that period,<br />
sales prices increased in US Dollar terms. In Euro, costs per ton decreased from €724 to €694 (4%) compared to fiscal 2006.<br />
46


