

2008 Annual report - Sappi
2008 Annual report - Sappi
2008 Annual report - Sappi

You also want an ePaper? Increase the reach of your titles
YUMPU automatically turns print PDFs into web optimized ePapers that Google loves.
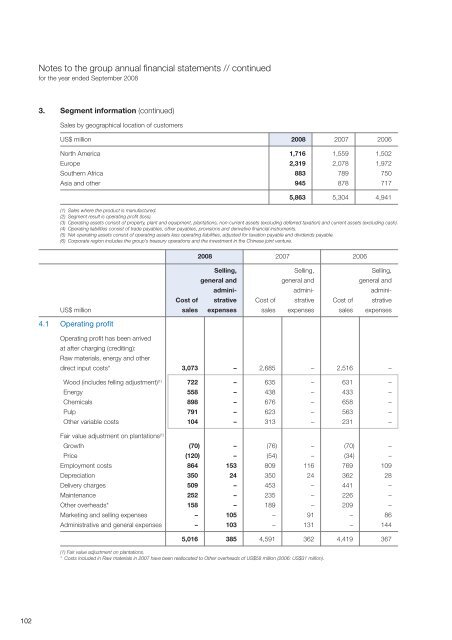
Notes to the group annual financial statements // continued<br />
for the year ended September <strong>2008</strong><br />
3. Segment information (continued)<br />
Sales by geographical location of customers<br />
US$ million <strong>2008</strong> 2007 2006<br />
North America 1,716 1,559 1,502<br />
Europe 2,319 2,078 1,972<br />
Southern Africa 883 789 750<br />
Asia and other 945 878 717<br />
5,863 5,304 4,941<br />
(1) Sales where the product is manufactured.<br />
(2) Segment result is operating profit (loss).<br />
(3) Operating assets consist of property, plant and equipment, plantations, non-current assets (excluding deferred taxation) and current assets (excluding cash).<br />
(4) Operating liabilities consist of trade payables, other payables, provisions and derivative financial instruments.<br />
(5) Net operating assets consist of operating assets less operating liabilities, adjusted for taxation payable and dividends payable.<br />
(6) Corporate region includes the group’s treasury operations and the investment in the Chinese joint venture.<br />
<strong>2008</strong> 2007 2006<br />
Selling, Selling, Selling,<br />
general and general and general and<br />
admini- admini- admini-<br />
Cost of strative Cost of strative Cost of strative<br />
US$ million sales expenses sales expenses sales expenses<br />
4.1 Operating profit<br />
Operating profit has been arrived<br />
at after charging (crediting):<br />
Raw materials, energy and other<br />
direct input costs* 3,073 – 2,685 – 2,516 –<br />
Wood (includes felling adjustment) (1) 722 – 635 – 631 –<br />
Energy 558 – 438 – 433 –<br />
Chemicals 898 – 676 – 658 –<br />
Pulp 791 – 623 – 563 –<br />
Other variable costs 104 – 313 – 231 –<br />
Fair value adjustment on plantations (1)<br />
Growth (70) – (76) – (70) –<br />
Price (120) – (54) – (34) –<br />
Employment costs 864 153 809 116 769 109<br />
Depreciation 350 24 350 24 362 28<br />
Delivery charges 509 – 453 – 441 –<br />
Maintenance 252 – 235 – 226 –<br />
Other overheads* 158 – 189 – 209 –<br />
Marketing and selling expenses – 105 – 91 – 86<br />
Administrative and general expenses – 103 – 131 – 144<br />
5,016 385 4,591 362 4,419 367<br />
(1) Fair value adjustment on plantations.<br />
* Costs included in Raw materials in 2007 have been reallocated to Other overheads of US$58 million (2006: US$31 million).<br />
102


