

2008 Annual report - Sappi
2008 Annual report - Sappi
2008 Annual report - Sappi

You also want an ePaper? Increase the reach of your titles
YUMPU automatically turns print PDFs into web optimized ePapers that Google loves.
sappi<br />
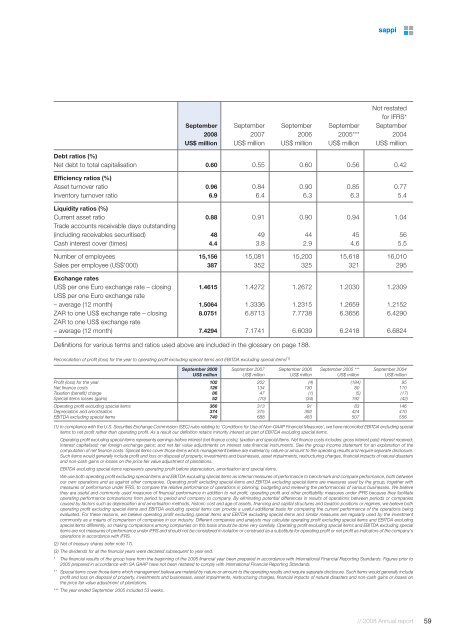
Not restated<br />
for IFRS*<br />
September September September September September<br />
<strong>2008</strong> 2007 2006 2005*** 2004<br />
US$ million US$ million US$ million US$ million US$ million<br />
Debt ratios (%)<br />
Net debt to total capitalisation 0.60 0.55 0.60 0.56 0.42<br />
Efficiency ratios (%)<br />
Asset turnover ratio 0.96 0.84 0.90 0.85 0.77<br />
Inventory turnover ratio 6.9 6.4 6.3 6.3 5.4<br />
Liquidity ratios (%)<br />
Current asset ratio 0.88 0.91 0.90 0.94 1.04<br />
Trade accounts receivable days outstanding<br />
(including receivables securitised) 48 49 44 45 56<br />
Cash interest cover (times) 4.4 3.8 2.9 4.6 5.5<br />
Number of employees 15,156 15,081 15,200 15,618 16,010<br />
Sales per employee (US$'000) 387 352 325 321 295<br />
Exchange rates<br />
US$ per one Euro exchange rate – closing 1.4615 1.4272 1.2672 1.2030 1.2309<br />
US$ per one Euro exchange rate<br />
– average (12 month) 1.5064 1.3336 1.2315 1.2659 1.2152<br />
ZAR to one US$ exchange rate – closing 8.0751 6.8713 7.7738 6.3656 6.4290<br />
ZAR to one US$ exchange rate<br />
– average (12 month) 7.4294 7.1741 6.6039 6.2418 6.6824<br />
Definitions for various terms and ratios used above are included in the glossary on page 188.<br />
Reconciliation of profit (loss) for the year to operating profit excluding special items and EBITDA excluding special items (1)<br />
September <strong>2008</strong> September 2007 September 2006 September 2005 *** September 2004<br />
US$ million US$ million US$ million US$ million US$ million<br />
Profit (loss) for the year 102 202 (4) (184) 95<br />
Net finance costs 126 134 130 80 110<br />
Taxation (benefit) charge 86 47 (1) (5) (17)<br />
Special items losses (gains) 52 (70) (34) 192 (42)<br />
Operating profit excluding special items 366 313 91 83 146<br />
Depreciation and amortisation 374 375 392 424 410<br />
EBITDA excluding special items 740 688 483 507 556<br />
(1) In compliance with the U.S. Securities Exchange Commission (SEC) rules relating to ‘Conditions for Use of Non-GAAP Financial Measures’, we have reconciled EBITDA excluding special<br />
items to net profit rather than operating profit. As a result our definition retains minority interest as part of EBITDA excluding special items.<br />
Operating profit excluding special items represents earnings before interest (net finance costs), taxation and special items. Net finance costs includes: gross interest paid; interest received;<br />
interest capitalised; net foreign exchange gains; and net fair value adjustments on interest rate financial instruments. See the group income statement for an explanation of the<br />
computation of net finance costs. Special items cover those items which management believe are material by nature or amount to the operating results and require separate disclosure.<br />
Such items would generally include profit and loss on disposal of property, investments and businesses, asset impairments, restructuring charges, financial impacts of natural disasters<br />
and non-cash gains or losses on the price fair value adjustment of plantations.<br />
EBITDA excluding special items represents operating profit before depreciation, amortisation and special items.<br />
We use both operating profit excluding special items and EBITDA excluding special items as internal measures of performance to benchmark and compare performance, both between<br />
our own operations and as against other companies. Operating profit excluding special items and EBITDA excluding special items are measures used by the group, together with<br />
measures of performance under IFRS, to compare the relative performance of operations in planning, budgeting and reviewing the performances of various businesses. We believe<br />
they are useful and commonly used measures of financial performance in addition to net profit, operating profit and other profitability measures under IFRS because they facilitate<br />
operating performance comparisons from period to period and company to company. By eliminating potential differences in results of operations between periods or companies<br />
caused by factors such as depreciation and amortisation methods, historic cost and age of assets, financing and capital structures and taxation positions or regimes, we believe both<br />
operating profit excluding special items and EBITDA excluding special items can provide a useful additional basis for comparing the current performance of the operations being<br />
evaluated. For these reasons, we believe operating profit excluding special items and EBITDA excluding special items and similar measures are regularly used by the investment<br />
community as a means of comparison of companies in our industry. Different companies and analysts may calculate operating profit excluding special items and EBITDA excluding<br />
special items differently, so making comparisons among companies on this basis should be done very carefully. Operating profit excluding special items and EBITDA excluding special<br />
items are not measures of performance under IFRS and should not be considered in isolation or construed as a substitute for operating profit or net profit as indicators of the company's<br />
operations in accordance with IFRS.<br />
(2) Net of treasury shares (refer note 17).<br />
(3) The dividends for all the financial years were declared subsequent to year end.<br />
* The financial results of the group have from the beginning of the 2005 financial year been prepared in accordance with International Financial Reporting Standards. Figures prior to<br />
2005 prepared in accordance with SA GAAP have not been restated to comply with International Financial Reporting Standards.<br />
** Special items cover those items which management believe are material by nature or amount to the operating results and require separate disclosure. Such items would generally include<br />
profit and loss on disposal of property, investments and businesses, asset impairments, restructuring charges, financial impacts of natural disasters and non-cash gains or losses on<br />
the price fair value adjustment of plantations.<br />
*** The year ended September 2005 included 53 weeks.<br />
// <strong>2008</strong> <strong>Annual</strong> <strong>report</strong><br />
59


