

2008 Annual report - Sappi
2008 Annual report - Sappi
2008 Annual report - Sappi

You also want an ePaper? Increase the reach of your titles
YUMPU automatically turns print PDFs into web optimized ePapers that Google loves.
sappi<br />
Cash flow analysis<br />
In the table below we present the group’s cash flow statement in a summarised format.<br />
US$ million <strong>2008</strong> 2007 2006<br />
Cash generated by operations before post employment benefits 711 686 464<br />
Contributions to post employment benefits (88) (101) (68)<br />
Cash generated by operations 623 585 396<br />
Net movement in working capital 1 60 (17)<br />
Cash generated by operating activities 624 645 379<br />
Cash spent to maintain and expand assets (505) (442) (303)<br />
Finance costs (126) (162) (138)<br />
Taxation (70) (27) (13)<br />
Other 11 78 16<br />
Dividends to shareholders (73) (68) (68)<br />
Net cash (utilised)/generated (139) 24 (127)<br />
In line with the required accounting disclosure, we show<br />
‘Contributions to post employment benefits’ (US$88 million and<br />
US$101 million in fiscal <strong>2008</strong> and fiscal 2007 respectively) as a<br />
reduction to ‘Cash generated by operations’. Approximately<br />
US$38 million in <strong>2008</strong> and US$49 million in 2007 of the<br />
contributions to post employment funding relate to ‘catchingup’<br />
on deficits in certain of our funds. Assuming stock markets<br />
recover in 2009 or 2010 and that long-term discount rates<br />
remain favourable to pension schemes, we expect the ‘catchup’<br />
element of our post retirement contribution payouts to<br />
reduce substantially in fiscal 2010 and thereafter.<br />
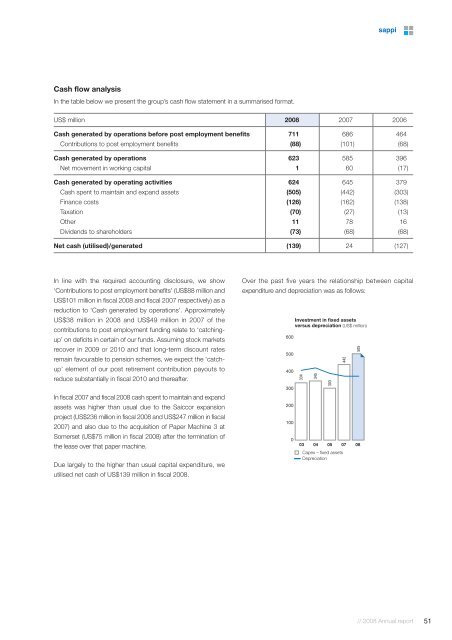
Over the past five years the relationship between capital<br />
expenditure and depreciation was as follows:<br />
In fiscal 2007 and fiscal <strong>2008</strong> cash spent to maintain and expand<br />
assets was higher than usual due to the Saiccor expansion<br />
project (US$236 million in fiscal <strong>2008</strong> and US$247 million in fiscal<br />
2007) and also due to the acquisition of Paper Machine 3 at<br />
Somerset (US$75 million in fiscal <strong>2008</strong>) after the termination of<br />
the lease over that paper machine.<br />
Due largely to the higher than usual capital expenditure, we<br />
utilised net cash of US$139 million in fiscal <strong>2008</strong>.<br />
// <strong>2008</strong> <strong>Annual</strong> <strong>report</strong><br />
51


