

treasure valley road dust study: final report - ResearchGate
treasure valley road dust study: final report - ResearchGate
treasure valley road dust study: final report - ResearchGate

Create successful ePaper yourself
Turn your PDF publications into a flip-book with our unique Google optimized e-Paper software.
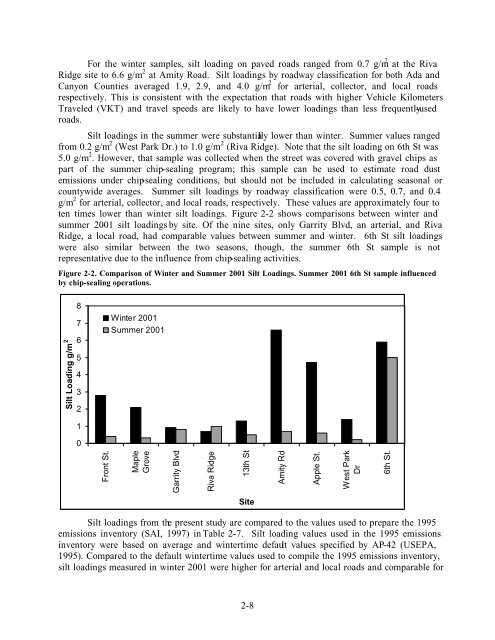
For the winter samples, silt loading on paved <strong>road</strong>s ranged from 0.7 g/m 2 at the Riva<br />
Ridge site to 6.6 g/m 2 at Amity Road. Silt loadings by <strong>road</strong>way classification for both Ada and<br />
Canyon Counties averaged 1.9, 2.9, and 4.0 g/m 2 for arterial, collector, and local <strong>road</strong>s<br />
respectively. This is consistent with the expectation that <strong>road</strong>s with higher Vehicle Kilometers<br />
Traveled (VKT) and travel speeds are likely to have lower loadings than less frequently-used<br />
<strong>road</strong>s.<br />
Silt loadings in the summer were substantially lower than winter. Summer values ranged<br />
from 0.2 g/m 2 (West Park Dr.) to 1.0 g/m 2 (Riva Ridge). Note that the silt loading on 6th St was<br />
5.0 g/m 2 . However, that sample was collected when the street was covered with gravel chips as<br />
part of the summer chip-sealing program; this sample can be used to estimate <strong>road</strong> <strong>dust</strong><br />
emissions under chip-sealing conditions, but should not be included in calculating seasonal or<br />
countywide averages. Summer silt loadings by <strong>road</strong>way classification were 0.5, 0.7, and 0.4<br />
g/m 2 for arterial, collector, and local <strong>road</strong>s, respectively. These values are approximately four to<br />
ten times lower than winter silt loadings. Figure 2-2 shows comparisons between winter and<br />
summer 2001 silt loadings by site. Of the nine sites, only Garrity Blvd, an arterial, and Riva<br />
Ridge, a local <strong>road</strong>, had comparable values between summer and winter. 6th St silt loadings<br />
were also similar between the two seasons, though, the summer 6th St sample is not<br />
representative due to the influence from chip-sealing activities.<br />
Figure 2-2. Comparison of Winter and Summer 2001 Silt Loadings. Summer 2001 6th St sample influenced<br />
by chip-sealing operations.<br />
Silt Loading g/m 2<br />
8<br />
7<br />
6<br />
5<br />
4<br />
3<br />
2<br />
1<br />
0<br />
Winter 2001<br />
Summer 2001<br />
Front St.<br />
Maple<br />
Grove<br />
Garrity Blvd<br />
Riva Ridge<br />
13th St<br />
Amity Rd<br />
Apple St.<br />
West Park<br />
Dr<br />
6th St.<br />
Site<br />
Silt loadings from the present <strong>study</strong> are compared to the values used to prepare the 1995<br />
emissions inventory (SAI, 1997) in Table 2-7. Silt loading values used in the 1995 emissions<br />
inventory were based on average and wintertime default values specified by AP-42 (USEPA,<br />
1995). Compared to the default wintertime values used to compile the 1995 emissions inventory,<br />
silt loadings measured in winter 2001 were higher for arterial and local <strong>road</strong>s and comparable for<br />
2-8


