

treasure valley road dust study: final report - ResearchGate
treasure valley road dust study: final report - ResearchGate
treasure valley road dust study: final report - ResearchGate

Create successful ePaper yourself
Turn your PDF publications into a flip-book with our unique Google optimized e-Paper software.
Fractional Line Loss<br />
1.2<br />
1<br />
0.8<br />
0.6<br />
0.4<br />
0.2<br />
0<br />
-0.2<br />
-0.4<br />
-0.6<br />
-0.8<br />
-1<br />
-1.2<br />
Background<br />
Right<br />
Left<br />
Precision<br />
0.56<br />
0.72<br />
0.92<br />
1.16<br />
1.44<br />
2.04<br />
2.88<br />
3.95<br />
5.59<br />
7.21<br />
9.87<br />
13.96<br />
19.75<br />
28.22<br />
40.31<br />
Aerodynamic Particle Size (um)<br />
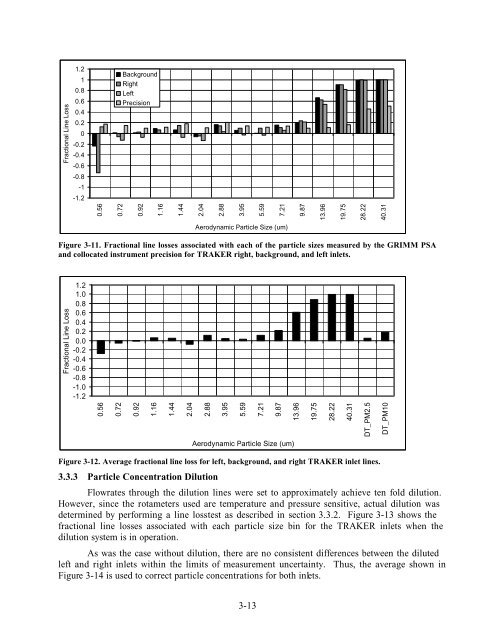
Figure 3-11. Fractional line losses associated with each of the particle sizes measured by the GRIMM PSA<br />
and collocated instrument precision for TRAKER right, background, and left inlets.<br />
Fractional Line Loss<br />
1.2<br />
1.0<br />
0.8<br />
0.6<br />
0.4<br />
0.2<br />
0.0<br />
-0.2<br />
-0.4<br />
-0.6<br />
-0.8<br />
-1.0<br />
-1.2<br />
0.56<br />
0.72<br />
0.92<br />
1.16<br />
1.44<br />
2.04<br />
2.88<br />
3.95<br />
5.59<br />
7.21<br />
9.87<br />
13.96<br />
19.75<br />
28.22<br />
40.31<br />
DT_PM2.5<br />
DT_PM10<br />
Aerodynamic Particle Size (um)<br />
Figure 3-12. Average fractional line loss for left, background, and right TRAKER inlet lines.<br />
3.3.3 Particle Concentration Dilution<br />
Flowrates through the dilution lines were set to approximately achieve ten fold dilution.<br />
However, since the rotameters used are temperature and pressure sensitive, actual dilution was<br />
determined by performing a line losstest as described in section 3.3.2. Figure 3-13 shows the<br />
fractional line losses associated with each particle size bin for the TRAKER inlets when the<br />
dilution system is in operation.<br />
As was the case without dilution, there are no consistent differences between the diluted<br />
left and right inlets within the limits of measurement uncertainty. Thus, the average shown in<br />
Figure 3-14 is used to correct particle concentrations for both inlets.<br />
3-13


