

treasure valley road dust study: final report - ResearchGate
treasure valley road dust study: final report - ResearchGate
treasure valley road dust study: final report - ResearchGate

You also want an ePaper? Increase the reach of your titles
YUMPU automatically turns print PDFs into web optimized ePapers that Google loves.
400<br />
Ford Ranger on NS Road by DW1<br />
400<br />
TRAKER and HUMVEE on EW Road by DW1<br />
350<br />
EF = 20 s<br />
R 2 = 0.65<br />
350<br />
Emissions Factor (g/vkt)<br />
300<br />
250<br />
200<br />
150<br />
100<br />
Emissions Factor (g/vkt)<br />
300<br />
250<br />
200<br />
150<br />
100<br />
EF = 24 s<br />
R 2 = 0.68<br />
50<br />
50<br />
0<br />
0 2 4 6 8 10 12 14 16<br />
Vehicle Speed (mps)<br />
0<br />
0 2 4 6 8 10 12 14 16<br />
Vehicle Speed (mps)<br />
400<br />
350<br />
Ford Ranger on NS Road by DW2<br />
EF = 19 s<br />
R 2 = 0.67<br />
400<br />
350<br />
TRAKER and HUMVEE on EW Road by DW2<br />
EF = 29.0 s<br />
R 2 = 0.92<br />
300<br />
300<br />
Emissions Factor (g/vkt)<br />
250<br />
200<br />
150<br />
Emissions Factor (g/vkt)<br />
250<br />
200<br />
150<br />
100<br />
100<br />
50<br />
50<br />
0<br />
0 2 4 6 8 10 12 14 16<br />
Vehicle Speed (mps)<br />
0<br />
0 2 4 6 8 10 12 14 16<br />
Vehicle Speed (mps)<br />
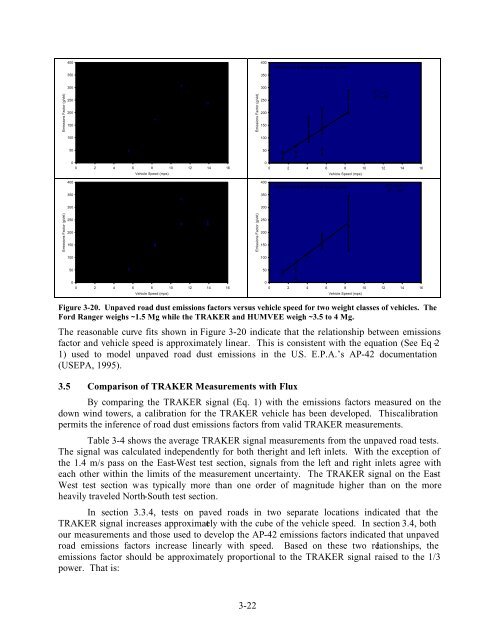
Figure 3-20. Unpaved <strong>road</strong> <strong>dust</strong> emissions factors versus vehicle speed for two weight classes of vehicles. The<br />
Ford Ranger weighs ~1.5 Mg while the TRAKER and HUMVEE weigh ~3.5 to 4 Mg.<br />
The reasonable curve fits shown in Figure 3-20 indicate that the relationship between emissions<br />
factor and vehicle speed is approximately linear. This is consistent with the equation (See Eq 2-<br />
1) used to model unpaved <strong>road</strong> <strong>dust</strong> emissions in the U.S. E.P.A.’s AP-42 documentation<br />
(USEPA, 1995).<br />
3.5 Comparison of TRAKER Measurements with Flux<br />
By comparing the TRAKER signal (Eq. 1) with the emissions factors measured on the<br />
down wind towers, a calibration for the TRAKER vehicle has been developed. This calibration<br />
permits the inference of <strong>road</strong> <strong>dust</strong> emissions factors from valid TRAKER measurements.<br />
Table 3-4 shows the average TRAKER signal measurements from the unpaved <strong>road</strong> tests.<br />
The signal was calculated independently for both theright and left inlets. With the exception of<br />
the 1.4 m/s pass on the East-West test section, signals from the left and right inlets agree with<br />
each other within the limits of the measurement uncertainty. The TRAKER signal on the East -<br />
West test section was typically more than one order of magnitude higher than on the more<br />
heavily traveled North-South test section.<br />
In section 3.3.4, tests on paved <strong>road</strong>s in two separate locations indicated that the<br />
TRAKER signal increases approximately with the cube of the vehicle speed. In section 3.4, both<br />
our measurements and those used to develop the AP-42 emissions factors indicated that unpaved<br />
<strong>road</strong> emissions factors increase linearly with speed. Based on these two relationships, the<br />
emissions factor should be approximately proportional to the TRAKER signal raised to the 1/3<br />
power. That is:<br />
3-22


