

treasure valley road dust study: final report - ResearchGate
treasure valley road dust study: final report - ResearchGate
treasure valley road dust study: final report - ResearchGate

You also want an ePaper? Increase the reach of your titles
YUMPU automatically turns print PDFs into web optimized ePapers that Google loves.
PM 10 and PM 2.5 by DustTrak and particle counts per size bin were averaged for the left and right<br />
inlets.<br />
In the Treasure Valley, a 440 m section of <strong>road</strong> was selected for testing. Passes were run<br />
over the same range of speeds as in Fort Bliss tests. The same lane of travel was surveyed with<br />
the vehicle traveling in both northbound and southbound directions. Using this approach, both<br />
the left and right inlets sampled the same tracks on the <strong>road</strong>. Values were averaged over each<br />
pass.<br />
The resulting values from both sets of tests were regressed against the vehicle speed<br />
using a power function:<br />
T<br />
* b<br />
T<br />
? TB<br />
? T s<br />
( 2 )<br />
where T T is the aerosol concentration at the vehicle tire, T B is the background aerosol<br />
concentration at the bumper inlet, and s is the speed of the vehicle. The parameters T * and b<br />
were iteratively calculated by minimizing the least squares error between the observed and<br />
predicted values.<br />
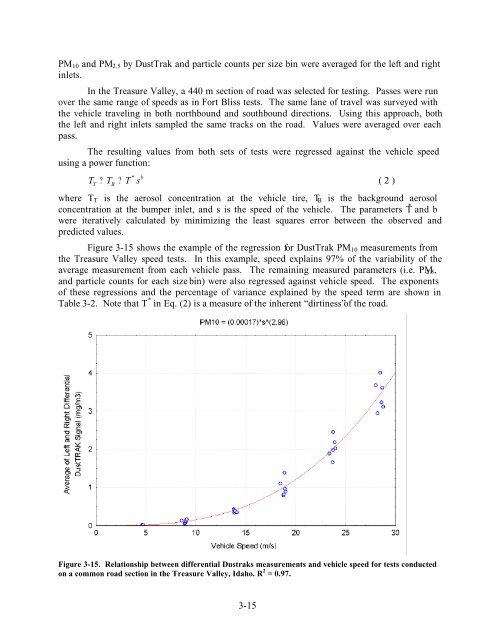
Figure 3-15 shows the example of the regression for DustTrak PM 10 measurements from<br />
the Treasure Valley speed tests. In this example, speed explains 97% of the variability of the<br />
average measurement from each vehicle pass. The remaining measured parameters (i.e. PM 2.5 ,<br />
and particle counts for each size bin) were also regressed against vehicle speed. The exponents<br />
of these regressions and the percentage of variance explained by the speed term are shown in<br />
Table 3-2. Note that T * in Eq. (2) is a measure of the inherent “dirtiness” of the <strong>road</strong>.<br />
Figure 3-15. Relationship between differential Dustraks measurements and vehicle speed for tests conducted<br />
on a common <strong>road</strong> section in the Treasure Valley, Idaho. R 2 = 0.97.<br />
3-15


