- Page 3 and 4:
Other Reports in This Series The Fu
- Page 5 and 6:
MIT Nuclear Fuel Cycle Study Adviso
- Page 7 and 8:
vi MIT STudy on The FuTure oF nucle
- Page 9 and 10:
viii MIT STudy on The FuTure oF nuc
- Page 11 and 12:
Study Findings and Recommendations
- Page 13 and 14:
Recommendation We recommend that a
- Page 15 and 16:
p Innovative nuclear energy applica
- Page 17 and 18:
p In line with many of our R&D reco
- Page 19 and 20:
The “once through” or open fuel
- Page 21 and 22:
have been implemented slowly. This
- Page 23 and 24:
Recommendation We recommend that th
- Page 25 and 26:
oped policies for specific wastes r
- Page 27 and 28:
nuClear Fuel CyCleS The united Stat
- Page 29 and 30:
- The primary differences were in t
- Page 31 and 32:
Recommendation Integrated system st
- Page 33 and 34:
Table 1.2 Summary of R&D Recommenda
- Page 35 and 36:
18 MIT STudy on The FuTure oF nucle
- Page 37 and 38:
the once-through Fuel Cycle for lig
- Page 39 and 40:
tricity costs. Waste management cos
- Page 41 and 42:
Figure 2.3 partial recycle of lWr S
- Page 43 and 44:
history of the nuclear Fuel Cycle B
- Page 45 and 46:
• What is the impact of timing of
- Page 47 and 48:
nuclear fuel cycles, the wastes (SN
- Page 49 and 50:
Because ore demand is closely coupl
- Page 51 and 52:
eStimatinG Future CoStS oF uranium
- Page 53 and 54: Figure 3.3 relative uranium Cost vs
- Page 55 and 56: Figure 3.4 100 year price trend for
- Page 57 and 58: Stockpiling If supply interruption
- Page 59 and 60: CitationS and noteS 1. Uranium 2007
- Page 61 and 62: If SNF is to be shipped, typically
- Page 63 and 64: a policy that maintains fuel cycle
- Page 65 and 66: Dry cask storage is used for short
- Page 67 and 68: For decommissioned sites, our econo
- Page 69 and 70: with its attractiveness of jobs and
- Page 71 and 72: 54 MIT STudy on The FuTure oF nucle
- Page 73 and 74: 2. The United States should create
- Page 75 and 76: Table 5.1 United States Waste Class
- Page 77 and 78: table 5.3 examples of operational G
- Page 79 and 80: Waste Isolation Pilot Plant The uni
- Page 81 and 82: Successful repository programs are
- Page 83 and 84: designed with limited SNF storage c
- Page 85 and 86: CitationS and noteS 1. A Handbook f
- Page 87 and 88: 70 MIT STudy on The FuTure oF nucle
- Page 89 and 90: energy spectrum centered at higher
- Page 91 and 92: light Water reactor Fuel technical
- Page 93 and 94: (fertile-free) to CR=1.0 (break-eve
- Page 95 and 96: license. However, fuel reprocessing
- Page 97 and 98: Figure 6.4 densification Factors as
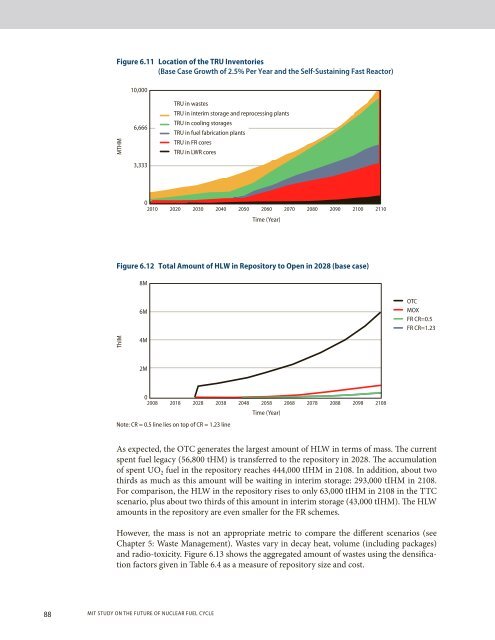
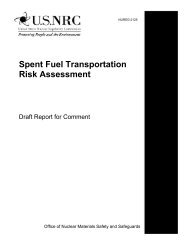
- Page 99 and 100: As expected, the breeder installed
- Page 101 and 102: Figure 6.8 shows the development of
- Page 103: Table 6.8 Uranium Cost in $/kg, Sta
- Page 107 and 108: SenSitivity analySiS: alternative a
- Page 109 and 110: Fast reactor technical Characterist
- Page 111 and 112: cooled fast reactor (SFR) fueled by
- Page 113 and 114: Summary oF ConCluSionS Among the in
- Page 115 and 116: [hoffman et al., 2006] e.a. hoffman
- Page 117 and 118: This chapter reports the cost of th
- Page 119 and 120: Table 7.1 Input Parameter Assumptio
- Page 121 and 122: Twice-Through Cycle Table 7.3 shows
- Page 123 and 124: Table 7.4 The LCOE for the Fast Rea
- Page 125 and 126: higher cost of disposal of the spen
- Page 127 and 128: 110 MIT STudy on The FuTure oF nucl
- Page 129 and 130: power program might be used, as is
- Page 131 and 132: Figure 8.1 Weapons-usability Charac
- Page 133 and 134: inStitutional approaCheS to Fuel Cy
- Page 135 and 136: the iaea additional protocol an Iae
- Page 137 and 138: in technology innovation are likely
- Page 139 and 140: Reprocessing choices Commercial rep
- Page 141 and 142: Table 8.2 Safeguard Technical Objec
- Page 143 and 144: 126 MIT STudy on The FuTure oF nucl
- Page 145 and 146: port for nuclear power over the per
- Page 147 and 148: Those Americans who have an opinion
- Page 149 and 150: who are very concerned with global
- Page 151 and 152: p Waste management must be integrat
- Page 153 and 154: options because we do not know toda
- Page 155 and 156:
Nuclear Security. Nonproliferation
- Page 157 and 158:
There have been major changes in ou
- Page 159 and 160:
There are large financial and polic
- Page 161 and 162:
Figure 3A.2 shows the results. As c
- Page 163 and 164:
Figure A.3 plots Eq (2), where adva
- Page 165 and 166:
Again, assuming that q = 0.29, the
- Page 167 and 168:
Note that Eq. [7] suggests employin
- Page 169 and 170:
Figure 3b.1 Cumulative probability
- Page 171 and 172:
154 MIT STudy on The FuTure oF nucl
- Page 173 and 174:
Figure 5a.1 decay of radioactivity
- Page 175 and 176:
and 241 Am. For the short term, hea
- Page 177 and 178:
Repository Engineering All reposito
- Page 179 and 180:
epreSentative repoSitory deSiGnS: u
- Page 181 and 182:
orehole diSpoSal There are three me
- Page 183 and 184:
166 MIT STudy on The FuTure oF nucl
- Page 185 and 186:
table 7a.1 list of variables , 1 lc
- Page 187 and 188:
The Twice-Through Cycle The LCOE fo
- Page 189 and 190:
A proper representation of the chai
- Page 191 and 192:
In the Twice-Through Cycle, the pai
- Page 193 and 194:
table 7a.2 once-through Fuel Cycle
- Page 195 and 196:
above ground storage. However, the
- Page 197 and 198:
CitationS and noteS 1. The methodol
- Page 199 and 200:
Historically, the interest in thori
- Page 201 and 202:
p Analogous to plutonium. Plutonium
- Page 203 and 204:
In case self-protection of U-232 da
- Page 205 and 206:
Figure a.3 Schematic view of Sbu an
- Page 207 and 208:
190 MIT STudy on The FuTure oF nucl
- Page 209 and 210:
eaCtor teChnoloGieS Nuclear power e
- Page 211 and 212:
via 239 Pu and 240 Pu, and then the
- Page 213 and 214:
urnups, but the gap between the nec
- Page 215 and 216:
(~700°C) with higher thermal-to-el
- Page 217 and 218:
There are several unique consequenc
- Page 219 and 220:
performance goals can be achieved.
- Page 221 and 222:
is that it will be many decades bef
- Page 223 and 224:
system [1]. The nuclear power plant
- Page 225 and 226:
The HTRs can be used to provide hig
- Page 227 and 228:
[http://nextgenerationnuclearplant.
- Page 229 and 230:
CitationS and noteS Brinkmann, H. U
- Page 231 and 232:
The analysis is based on the assump
- Page 233 and 234:
considerations discussed above. We
- Page 235 and 236:
In our analysis we make the explici
- Page 237 and 238:
Figure d.4 transmutation Consequenc
- Page 239 and 240:
Figure d.5 breeder Consequences LWR
- Page 241 and 242:
facilities. These concerns are the
- Page 243 and 244:
Technological applicability Geologi
- Page 245 and 246:
It must be noted, that net risks an
- Page 247 and 248:
p Once-through fast reactor fuel. T
- Page 249 and 250:
Table E.1 Recycling Plant Functions
- Page 251 and 252:
Table E.3 Conventional Fuel Fabrica
- Page 253 and 254:
eactor. A summary of inputs from in
- Page 255 and 256:
this page intentionally left blank
- Page 257:
this page intentionally left blank