The FuTure oF nuclear Fuel cycle - MIT Energy Initiative
The FuTure oF nuclear Fuel cycle - MIT Energy Initiative
The FuTure oF nuclear Fuel cycle - MIT Energy Initiative

You also want an ePaper? Increase the reach of your titles
YUMPU automatically turns print PDFs into web optimized ePapers that Google loves.
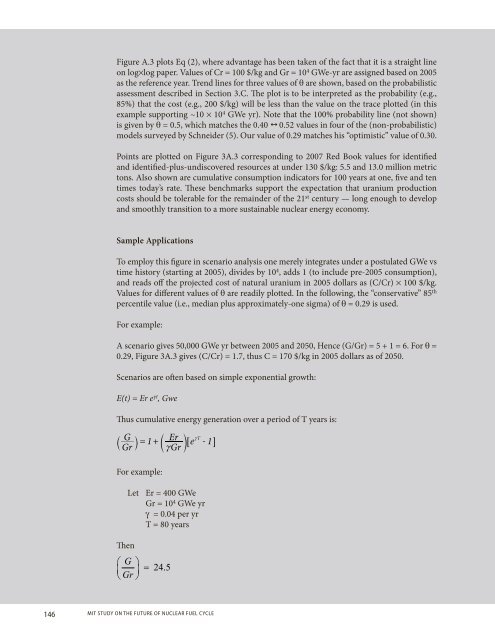
Figure A.3 plots Eq (2), where advantage has been taken of the fact that it is a straight line<br />
on log×log paper. Values of Cr = 100 $/kg and Gr = 10 4 GWe-yr are assigned based on 2005<br />
as the reference year. Trend lines for three values of q are shown, based on the probabilistic<br />
assessment described in Section 3.C. <strong>The</strong> plot is to be interpreted as the probability (e.g.,<br />
85%) that the cost (e.g., 200 $/kg) will be less than the value on the trace plotted (in this<br />
example supporting ~10 × 10 4 GWe yr). Note that the 100% probability line (not shown)<br />
is given by q = 0.5, which matches the 0.40 1 0.52 values in four of the (non-probabilistic)<br />
models surveyed by Schneider (5). Our value of 0.29 matches his “optimistic” value of 0.30.<br />
Points are plotted on Figure 3A.3 corresponding to 2007 Red Book values for identified<br />
and identified-plus-undiscovered resources at under 130 $/kg: 5.5 and 13.0 million metric<br />
tons. Also shown are cumulative consumption indicators for 100 years at one, five and ten<br />
times today’s rate. <strong>The</strong>se benchmarks support the expectation that uranium production<br />
costs should be tolerable for the remainder of the 21 st century — long enough to develop<br />
and smoothly transition to a more sustainable <strong>nuclear</strong> energy economy.<br />
Sample Applications<br />
To employ this figure in scenario analysis one merely integrates under a postulated GWe vs<br />
time history (starting at 2005), divides by 10 4 , adds 1 (to include pre-2005 consumption),<br />
and reads off the projected cost of natural uranium in 2005 dollars as (C/Cr) × 100 $/kg.<br />
Values for different values of q are readily plotted. In the following, the “conservative” 85 th<br />
percentile value (i.e., median plus approximately-one sigma) of q = 0.29 is used.<br />
For example:<br />
A scenario gives 50,000 GWe yr between 2005 and 2050, Hence (G/Gr) = 5 + 1 = 6. For q =<br />
0.29, Figure 3A.3 gives (C/Cr) = 1.7, thus C = 170 $/kg in 2005 dollars as of 2050.<br />
Scenarios are often based on simple exponential growth:<br />
E(t) = Er e γt , Gwe<br />
Thus cumulative energy generation over a period of T years is:<br />
`<br />
G<br />
Gr<br />
1<br />
Er cT<br />
j = + c e - 1<br />
cGr<br />
m6 @<br />
For example:<br />
<strong>The</strong>n<br />
Let Er = 400 GWe<br />
Gr = 10 4 GWe yr<br />
g = 0.04 per yr<br />
T = 80 years<br />
146 <strong>MIT</strong> STudy on <strong>The</strong> <strong>FuTure</strong> <strong>oF</strong> <strong>nuclear</strong> <strong>Fuel</strong> <strong>cycle</strong>