The FuTure oF nuclear Fuel cycle - MIT Energy Initiative
The FuTure oF nuclear Fuel cycle - MIT Energy Initiative
The FuTure oF nuclear Fuel cycle - MIT Energy Initiative

You also want an ePaper? Increase the reach of your titles
YUMPU automatically turns print PDFs into web optimized ePapers that Google loves.
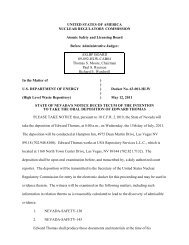
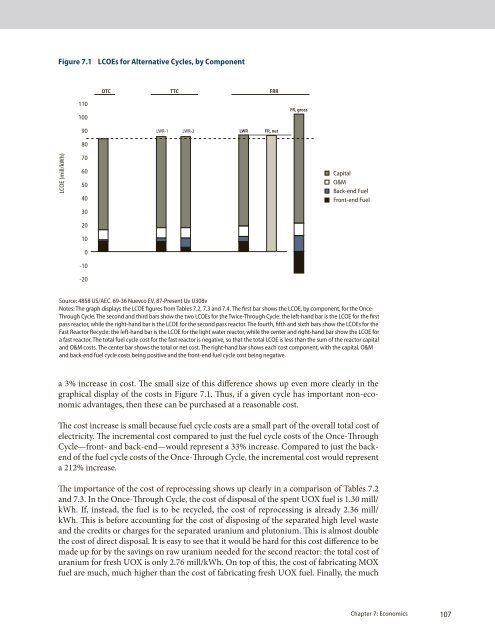
Figure 7.1 lCoes for alternative Cycles, by Component<br />
OTC TTC FRR<br />
110<br />
100<br />
FR, gross<br />
90<br />
lWr-1<br />
lWr-2<br />
LWR<br />
FR, net<br />
80<br />
lcoe (mill/kWh)<br />
70<br />
60<br />
50<br />
40<br />
30<br />
20<br />
10<br />
0<br />
-10<br />
-20<br />
capital<br />
o&M<br />
Back-end <strong>Fuel</strong><br />
Front-end <strong>Fuel</strong><br />
Source: 4858 uS/aec. 69-36 nuevco eV, 87-Present uv u308v<br />
notes: <strong>The</strong> graph displays the lcoe figures from Tables 7.2, 7.3 and 7.4. <strong>The</strong> first bar shows the lcoe, by component, for the once-<br />
Through <strong>cycle</strong>. <strong>The</strong> second and third bars show the two lcoes for the Twice-Through <strong>cycle</strong>: the left-hand bar is the lcoe for the first<br />
pass reactor, while the right-hand bar is the lcoe for the second pass reactor. <strong>The</strong> fourth, fifth and sixth bars show the lcoes for the<br />
Fast reactor re<strong>cycle</strong>: the left-hand bar is the lcoe for the light water reactor, while the center and right-hand bar show the lcoe for<br />
a fast reactor. <strong>The</strong> total fuel <strong>cycle</strong> cost for the fast reactor is negative, so that the total lcoe is less than the sum of the reactor capital<br />
and o&M costs. <strong>The</strong> center bar shows the total or net cost. <strong>The</strong> right-hand bar shows each cost component, with the capital, o&M<br />
and back-end fuel <strong>cycle</strong> costs being positive and the front-end fuel <strong>cycle</strong> cost being negative.<br />
a 3% increase in cost. <strong>The</strong> small size of this difference shows up even more clearly in the<br />
graphical display of the costs in Figure 7.1. Thus, if a given <strong>cycle</strong> has important non-economic<br />
advantages, then these can be purchased at a reasonable cost.<br />
<strong>The</strong> cost increase is small because fuel <strong>cycle</strong> costs are a small part of the overall total cost of<br />
electricity. <strong>The</strong> incremental cost compared to just the fuel <strong>cycle</strong> costs of the Once-Through<br />
Cycle—front- and back-end—would represent a 33% increase. Compared to just the backend<br />
of the fuel <strong>cycle</strong> costs of the Once-Through Cycle, the incremental cost would represent<br />
a 212% increase.<br />
<strong>The</strong> importance of the cost of reprocessing shows up clearly in a comparison of Tables 7.2<br />
and 7.3. In the Once-Through Cycle, the cost of disposal of the spent UOX fuel is 1.30 mill/<br />
kWh. If, instead, the fuel is to be re<strong>cycle</strong>d, the cost of reprocessing is already 2.36 mill/<br />
kWh. This is before accounting for the cost of disposing of the separated high level waste<br />
and the credits or charges for the separated uranium and plutonium. This is almost double<br />
the cost of direct disposal. It is easy to see that it would be hard for this cost difference to be<br />
made up for by the savings on raw uranium needed for the second reactor: the total cost of<br />
uranium for fresh UOX is only 2.76 mill/kWh. On top of this, the cost of fabricating MOX<br />
fuel are much, much higher than the cost of fabricating fresh UOX fuel. Finally, the much<br />
chapter 7: economics 107