100th Annual Report 2006-2007 - Tata Steel
100th Annual Report 2006-2007 - Tata Steel
100th Annual Report 2006-2007 - Tata Steel
You also want an ePaper? Increase the reach of your titles
YUMPU automatically turns print PDFs into web optimized ePapers that Google loves.
Management Discussion and Analysis<br />
3. Analysis of the Financial Performance of the<br />
Company<br />
a) Net sales/Income from operations<br />
Figures in Rs. crores<br />
FY <strong>2006</strong>-07 FY 2005-06 Change Change %<br />
Sales of products 19,018.20 16,521.44 2,496.76 15%<br />
Sale of power and<br />
water<br />
513.96 393.50 120.46 31%<br />
Income from services,<br />
sale of miscellaneous<br />
goods, stores and rent<br />
230.41 229.28 1.13 0%<br />
etc.<br />
Total sale of products<br />
and services<br />
19,762.57 17,144.22 2,618.35 15%<br />
Less : Excise Duty 2,210.55 1,928.72 281.83 15%<br />
Net sales/income from<br />
operations<br />
17,552.02 15,215.50 2,336.52 15%<br />
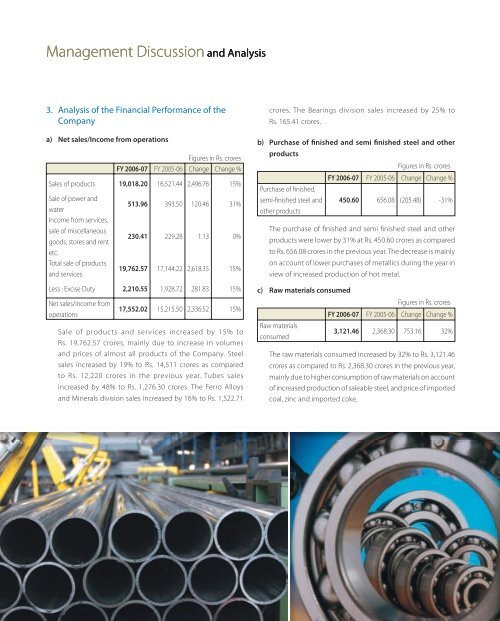
Sale of products and services increased by 15% to<br />
Rs. 19,762.57 crores, mainly due to increase in volumes<br />
and prices of almost all products of the Company. <strong>Steel</strong><br />
sales increased by 19% to Rs. 14,511 crores as compared<br />
to Rs. 12,220 crores in the previous year. Tubes sales<br />
increased by 48% to Rs. 1,276.30 crores. The Ferro Alloys<br />
and Minerals division sales increased by 16% to Rs. 1,522.71<br />
crores. The Bearings division sales increased by 25% to<br />
Rs. 165.41 crores.<br />
b) Purchase of finished and semi finished steel and other<br />
products<br />
Figures in Rs. crores<br />
Purchase of finished,<br />
semi-finished steel and<br />
other products<br />
FY <strong>2006</strong>-07 FY 2005-06 Change Change %<br />
450.60 656.08 (205.48) -31%<br />
The purchase of finished and semi finished steel and other<br />
products were lower by 31% at Rs. 450.60 crores as compared<br />
to Rs. 656.08 crores in the previous year. The decrease is mainly<br />
on account of lower purchases of metallics during the year in<br />
view of increased production of hot metal.<br />
c) Raw materials consumed<br />
Raw materials<br />
consumed<br />
Figures in Rs. crores<br />
FY <strong>2006</strong>-07 FY 2005-06 Change Change %<br />
3,121.46 2,368.30 753.16 32%<br />
The raw materials consumed increased by 32% to Rs. 3,121.46<br />
crores as compared to Rs. 2,368.30 crores in the previous year,<br />
mainly due to higher consumption of raw materials on account<br />
of increased production of saleable steel, and price of imported<br />
coal, zinc and imported coke.<br />
102


