100th Annual Report 2006-2007 - Tata Steel
100th Annual Report 2006-2007 - Tata Steel
100th Annual Report 2006-2007 - Tata Steel

You also want an ePaper? Increase the reach of your titles
YUMPU automatically turns print PDFs into web optimized ePapers that Google loves.
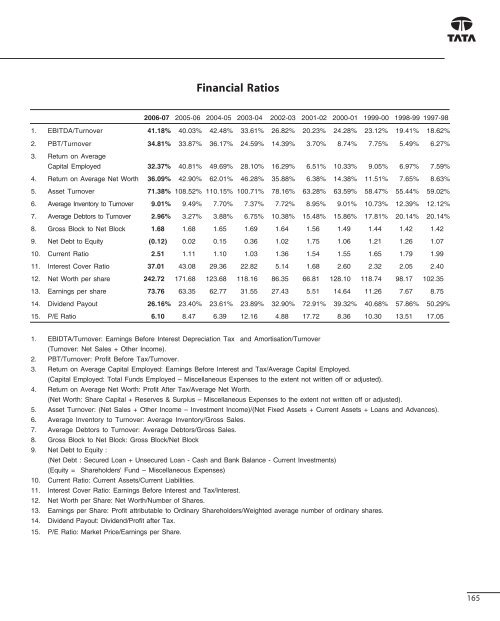
Financial Ratios<br />
<strong>2006</strong>-07 2005-06 2004-05 2003-04 2002-03 2001-02 2000-01 1999-00 1998-99 1997-98<br />
1. EBITDA/Turnover 41.18% 40.03% 42.48% 33.61% 26.82% 20.23% 24.28% 23.12% 19.41% 18.62%<br />
2. PBT/Turnover 34.81% 33.87% 36.17% 24.59% 14.39% 3.70% 8.74% 7.75% 5.49% 6.27%<br />
3. Return on Average<br />
Capital Employed 32.37% 40.81% 49.69% 28.10% 16.29% 6.51% 10.33% 9.05% 6.97% 7.59%<br />
4. Return on Average Net Worth 36.09% 42.90% 62.01% 46.28% 35.88% 6.38% 14.38% 11.51% 7.65% 8.63%<br />
5. Asset Turnover 71.38% 108.52% 110.15% 100.71% 78.16% 63.28% 63.59% 58.47% 55.44% 59.02%<br />
6. Average Inventory to Turnover 9.01% 9.49% 7.70% 7.37% 7.72% 8.95% 9.01% 10.73% 12.39% 12.12%<br />
7. Average Debtors to Turnover 2.96% 3.27% 3.88% 6.75% 10.38% 15.48% 15.86% 17.81% 20.14% 20.14%<br />
8. Gross Block to Net Block 1.68 1.68 1.65 1.69 1.64 1.56 1.49 1.44 1.42 1.42<br />
9. Net Debt to Equity (0.12) 0.02 0.15 0.36 1.02 1.75 1.06 1.21 1.26 1.07<br />
10. Current Ratio 2.51 1.11 1.10 1.03 1.36 1.54 1.55 1.65 1.79 1.99<br />
11. Interest Cover Ratio 37.01 43.08 29.36 22.82 5.14 1.68 2.60 2.32 2.05 2.40<br />
12. Net Worth per share 242.72 171.68 123.68 118.16 86.35 66.81 128.10 118.74 98.17 102.35<br />
13. Earnings per share 73.76 63.35 62.77 31.55 27.43 5.51 14.64 11.26 7.67 8.75<br />
14. Dividend Payout 26.16% 23.40% 23.61% 23.89% 32.90% 72.91% 39.32% 40.68% 57.86% 50.29%<br />
15. P/E Ratio 6.10 8.47 6.39 12.16 4.88 17.72 8.36 10.30 13.51 17.05<br />
1. EBIDTA/Turnover: Earnings Before Interest Depreciation Tax and Amortisation/Turnover<br />
(Turnover: Net Sales + Other Income).<br />
2. PBT/Turnover: Profit Before Tax/Turnover.<br />
3. Return on Average Capital Employed: Earnings Before Interest and Tax/Average Capital Employed.<br />
(Capital Employed: Total Funds Employed – Miscellaneous Expenses to the extent not written off or adjusted).<br />
4. Return on Average Net Worth: Profit After Tax/Average Net Worth.<br />
(Net Worth: Share Capital + Reserves & Surplus – Miscellaneous Expenses to the extent not written off or adjusted).<br />
5. Asset Turnover: (Net Sales + Other Income – Investment Income)/(Net Fixed Assets + Current Assets + Loans and Advances).<br />
6. Average Inventory to Turnover: Average Inventory/Gross Sales.<br />
7. Average Debtors to Turnover: Average Debtors/Gross Sales.<br />
8. Gross Block to Net Block: Gross Block/Net Block<br />
9. Net Debt to Equity :<br />
(Net Debt : Secured Loan + Unsecured Loan - Cash and Bank Balance - Current Investments)<br />
(Equity = Shareholders' Fund – Miscellaneous Expenses)<br />
10. Current Ratio: Current Assets/Current Liabilities.<br />
11. Interest Cover Ratio: Earnings Before Interest and Tax/Interest.<br />
12. Net Worth per Share: Net Worth/Number of Shares.<br />
13. Earnings per Share: Profit attributable to Ordinary Shareholders/Weighted average number of ordinary shares.<br />
14. Dividend Payout: Dividend/Profit after Tax.<br />
15. P/E Ratio: Market Price/Earnings per Share.<br />
165