100th Annual Report 2006-2007 - Tata Steel
100th Annual Report 2006-2007 - Tata Steel
100th Annual Report 2006-2007 - Tata Steel

Create successful ePaper yourself
Turn your PDF publications into a flip-book with our unique Google optimized e-Paper software.
Hundredth annual report <strong>2006</strong>-07<br />
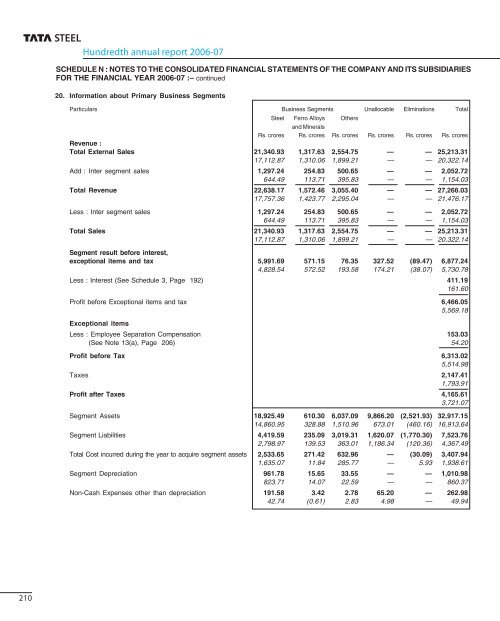
SCHEDULE N : NOTES TO THE CONSOLIDATED FINANCIAL STATEMENTS OF THE COMPANY AND ITS SUBSIDIARIES<br />
FOR THE FINANCIAL YEAR <strong>2006</strong>-07 :– continued<br />
20. Information about Primary Business Segments<br />
Particulars Business Segments Unallocable Eliminations Total<br />
<strong>Steel</strong> Ferro Alloys Others<br />
and Minerals<br />
Rs. crores Rs. crores Rs. crores Rs. crores Rs. crores Rs. crores<br />
Revenue :<br />
Total External Sales 21,340.93 1,317.63 2,554.75 — — 25,213.31<br />
17,112.87 1,310.06 1,899.21 — — 20,322.14<br />
Add : Inter segment sales 1,297.24 254.83 500.65 — — 2,052.72<br />
644.49 113.71 395.83 — — 1,154.03<br />
Total Revenue 22,638.17 1,572.46 3,055.40 — — 27,266.03<br />
17,757.36 1,423.77 2,295.04 — — 21,476.17<br />
Less : Inter segment sales 1,297.24 254.83 500.65 — — 2,052.72<br />
644.49 113.71 395.83 — — 1,154.03<br />
Total Sales 21,340.93 1,317.63 2,554.75 — — 25,213.31<br />
17,112.87 1,310.06 1,899.21 — — 20,322.14<br />
Segment result before interest,<br />
exceptional items and tax 5,991.69 571.15 76.35 327.52 (89.47) 6,877.24<br />
4,828.54 572.52 193.58 174.21 (38.07) 5,730.78<br />
Less : Interest (See Schedule 3, Page 192) 411.19<br />
161.60<br />
Profit before Exceptional items and tax 6,466.05<br />
5,569.18<br />
Exceptional items<br />
Less : Employee Separation Compensation 153.03<br />
(See Note 13(a), Page 206) 54.20<br />
Profit before Tax 6,313.02<br />
5,514.98<br />
Taxes 2,147.41<br />
1,793.91<br />
Profit after Taxes 4,165.61<br />
3,721.07<br />
Segment Assets 18,925.49 610.30 6,037.09 9,866.20 (2,521.93) 32,917.15<br />
14,860.95 328.88 1,510.96 673.01 (460.16) 16,913.64<br />
Segment Liabilities 4,419.59 235.09 3,019.31 1,620.07 (1,770.30) 7,523.76<br />
2,798.97 139.53 363.01 1,186.34 (120.36) 4,367.49<br />
Total Cost incurred during the year to acquire segment assets 2,533.65 271.42 632.96 — (30.09) 3,407.94<br />
1,635.07 11.84 285.77 — 5.93 1,938.61<br />
Segment Depreciation 961.78 15.65 33.55 — — 1,010.98<br />
823.71 14.07 22.59 — — 860.37<br />
Non-Cash Expenses other than depreciation 191.58 3.42 2.78 65.20 — 262.98<br />
42.74 (0.61) 2.83 4.98 — 49.94<br />
210