100th Annual Report 2006-2007 - Tata Steel
100th Annual Report 2006-2007 - Tata Steel
100th Annual Report 2006-2007 - Tata Steel

You also want an ePaper? Increase the reach of your titles
YUMPU automatically turns print PDFs into web optimized ePapers that Google loves.
Management Discussion and Analysis<br />
iron ore leases to the Government and the approval process is<br />
in progress.<br />
The Company is also pursuing setting up integrated steel<br />
plants in Chhattisgarh and Jharkhand in phases in the<br />
future.<br />
c) Other Projects in India<br />
The Company is setting up a 1.6 million tonne metallurgical<br />
coke making facility in Haldia to support future enhanced coke<br />
requirement in Jamshedpur. The project cost is estimated at<br />
Rs. 1,150 crores and will be commissioned by March 2008. The<br />
Company has acquired requisite land, completed civil work and<br />
placed orders for major equipments.<br />
2. Primary steel making in countries rich in Iron Ore and / or<br />
Coal / Gas<br />
The Company believes in a de-integrated production<br />
philosophy to maximise value in the steel industry. The<br />
Company has identified possible locations to set up primary<br />
steel making facilities in the long term. These locations<br />
(including India) are attractive by virtue of competitive factors<br />
of production i.e. availability of raw material, energy sources<br />
etc. The Company intends to link low cost steel production<br />
facilities with the most favourable steel consuming markets,<br />
to maximise value creation across the entire value chain. The<br />
Company intends to have a balance between the growing<br />
markets of the developing countries and the mature markets<br />
with high end products and technology. Investments in<br />
Nat<strong>Steel</strong> Asia Pte. Ltd. and <strong>Tata</strong> <strong>Steel</strong> (Thailand) Public Co.<br />
Ltd., (erstwhile Millennium <strong>Steel</strong>) were steps taken in this<br />
direction.<br />
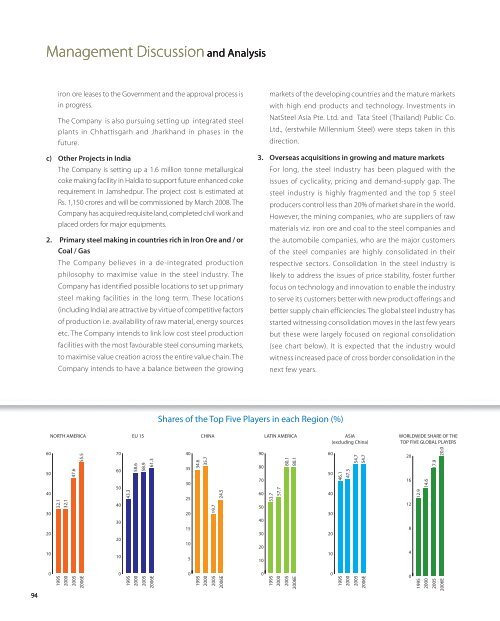
3. Overseas acquisitions in growing and mature markets<br />
For long, the steel industry has been plagued with the<br />
issues of cyclicality, pricing and demand-supply gap. The<br />
steel industry is highly fragmented and the top 5 steel<br />
producers control less than 20% of market share in the world.<br />
However, the mining companies, who are suppliers of raw<br />
materials viz. iron ore and coal to the steel companies and<br />
the automobile companies, who are the major customers<br />
of the steel companies are highly consolidated in their<br />
respective sectors. Consolidation in the steel industry is<br />
likely to address the issues of price stability, foster further<br />
focus on technology and innovation to enable the industry<br />
to serve its customers better with new product offerings and<br />
better supply chain efficiencies. The global steel industry has<br />
started witnessing consolidation moves in the last few years<br />
but these were largely focused on regional consolidation<br />
(see chart below). It is expected that the industry would<br />
witness increased pace of cross border consolidation in the<br />
next few years.<br />
Shares of the Top Five Players in each Region (%)<br />
NORTH AMERICA<br />
EU 15<br />
CHINA<br />
LATIN AMERICA<br />
ASIA<br />
(excluding China)<br />
WORLDWIDE SHARE OF THE<br />
TOP FIVE GLOBAL PLAYERS<br />
94<br />
60<br />
50<br />
40<br />
30<br />
20<br />
10<br />
0<br />
1995 32.1<br />
2000<br />
32.1<br />
47.6<br />
55.5<br />
2005<br />
<strong>2006</strong>E<br />
70<br />
60<br />
50<br />
40<br />
30<br />
20<br />
10<br />
0<br />
1995 43.3<br />
2000<br />
58.6<br />
58.9<br />
61.3<br />
2005<br />
<strong>2006</strong>E<br />
40<br />
35<br />
30<br />
25<br />
20<br />
15<br />
10<br />
5<br />
0<br />
1995 34.6<br />
35.7<br />
19.7<br />
24.5<br />
2000<br />
2005<br />
<strong>2006</strong>E<br />
90<br />
80<br />
70<br />
60<br />
50<br />
40<br />
30<br />
20<br />
10<br />
0<br />
1995 53.7<br />
2000<br />
57.7<br />
80.1<br />
80.1<br />
2005<br />
<strong>2006</strong>E<br />
60<br />
50<br />
40<br />
30<br />
20<br />
10<br />
0<br />
54.7<br />
54.7<br />
1995 46.1<br />
2000<br />
47.3<br />
2005<br />
<strong>2006</strong>E<br />
20<br />
16<br />
12<br />
8<br />
4<br />
0<br />
1995 12.9<br />
2000<br />
14.6<br />
2005<br />
17.9<br />
<strong>2006</strong>E<br />
20.0