100th Annual Report 2006-2007 - Tata Steel
100th Annual Report 2006-2007 - Tata Steel
100th Annual Report 2006-2007 - Tata Steel

You also want an ePaper? Increase the reach of your titles
YUMPU automatically turns print PDFs into web optimized ePapers that Google loves.
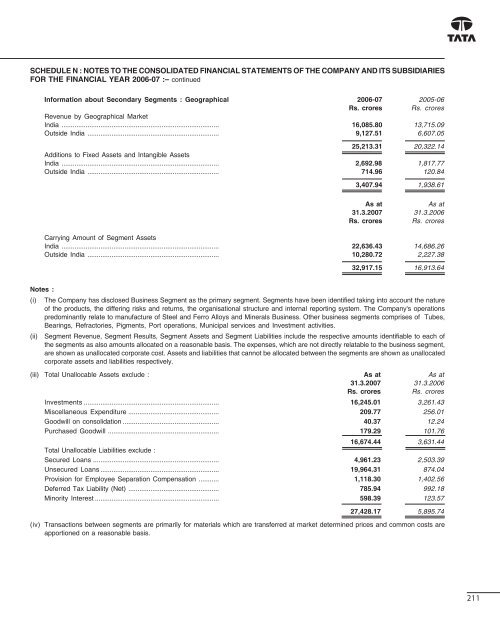
SCHEDULE N : NOTES TO THE CONSOLIDATED FINANCIAL STATEMENTS OF THE COMPANY AND ITS SUBSIDIARIES<br />
FOR THE FINANCIAL YEAR <strong>2006</strong>-07 :– continued<br />
Information about Secondary Segments : Geographical <strong>2006</strong>-07 2005-06<br />
Rs. crores Rs. crores<br />
Revenue by Geographical Market<br />
India ..................................................................................... 16,085.80 13,715.09<br />
Outside India ....................................................................... 9,127.51 6,607.05<br />
25,213.31 20,322.14<br />
Additions to Fixed Assets and Intangible Assets<br />
India ..................................................................................... 2,692.98 1,817.77<br />
Outside India ....................................................................... 714.96 120.84<br />
3,407.94 1,938.61<br />
As at<br />
As at<br />
31.3.<strong>2007</strong> 31.3.<strong>2006</strong><br />
Rs. crores Rs. crores<br />
Carrying Amount of Segment Assets<br />
India ..................................................................................... 22,636.43 14,686.26<br />
Outside India ....................................................................... 10,280.72 2,227.38<br />
32,917.15 16,913.64<br />
Notes :<br />
(i) The Company has disclosed Business Segment as the primary segment. Segments have been identified taking into account the nature<br />
of the products, the differing risks and returns, the organisational structure and internal reporting system. The Company's operations<br />
predominantly relate to manufacture of <strong>Steel</strong> and Ferro Alloys and Minerals Business. Other business segments comprises of Tubes,<br />
Bearings, Refractories, Pigments, Port operations, Municipal services and Investment activities.<br />
(ii) Segment Revenue, Segment Results, Segment Assets and Segment Liabilities include the respective amounts identifiable to each of<br />
the segments as also amounts allocated on a reasonable basis. The expenses, which are not directly relatable to the business segment,<br />
are shown as unallocated corporate cost. Assets and liabilities that cannot be allocated between the segments are shown as unallocated<br />
corporate assets and liabilities respectively.<br />
(iii) Total Unallocable Assets exclude : As at As at<br />
31.3.<strong>2007</strong> 31.3.<strong>2006</strong><br />
Rs. crores Rs. crores<br />
Investments ......................................................................... 16,245.01 3,261.43<br />
Miscellaneous Expenditure ................................................. 209.77 256.01<br />
Goodwill on consolidation .................................................... 40.37 12.24<br />
Purchased Goodwill ............................................................ 179.29 101.76<br />
16,674.44 3,631.44<br />
Total Unallocable Liabilities exclude :<br />
Secured Loans .................................................................... 4,961.23 2,503.39<br />
Unsecured Loans ................................................................ 19,964.31 874.04<br />
Provision for Employee Separation Compensation ........... 1,118.30 1,402.56<br />
Deferred Tax Liability (Net) ................................................. 785.94 992.18<br />
Minority Interest ................................................................... 598.39 123.57<br />
27,428.17 5,895.74<br />
(iv) Transactions between segments are primarily for materials which are transferred at market determined prices and common costs are<br />
apportioned on a reasonable basis.<br />
211