100th Annual Report 2006-2007 - Tata Steel
100th Annual Report 2006-2007 - Tata Steel
100th Annual Report 2006-2007 - Tata Steel

Create successful ePaper yourself
Turn your PDF publications into a flip-book with our unique Google optimized e-Paper software.
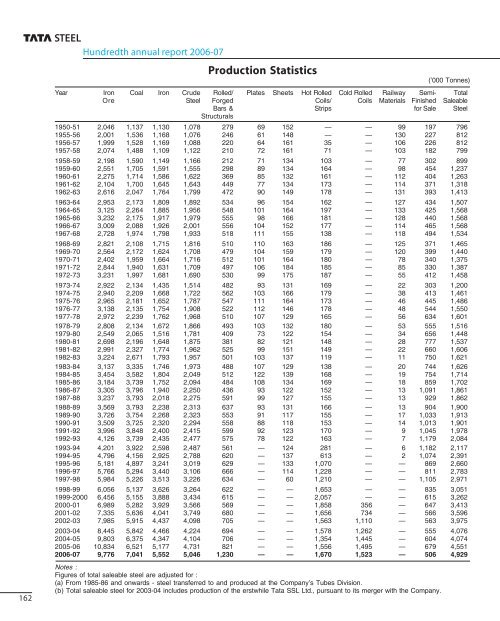
Hundredth annual report <strong>2006</strong>-07<br />
162<br />
Production Statistics<br />
(’000 Tonnes)<br />
Year Iron Coal Iron Crude Rolled/ Plates Sheets Hot Rolled Cold Rolled Railway Semi- Total<br />
Ore <strong>Steel</strong> Forged Coils/ Coils Materials Finished Saleable<br />
Bars & Strips for Sale <strong>Steel</strong><br />
Structurals<br />
1950-51 2,046 1,137 1,130 1,078 279 69 152 — — 99 197 796<br />
1955-56 2,001 1,536 1,168 1,076 246 61 148 — — 130 227 812<br />
1956-57 1,999 1,528 1,169 1,088 220 64 161 35 — 106 226 812<br />
1957-58 2,074 1,488 1,109 1,122 210 72 161 71 — 103 182 799<br />
1958-59 2,198 1,590 1,149 1,166 212 71 134 103 — 77 302 899<br />
1959-60 2,551 1,705 1,591 1,555 298 89 134 164 — 98 454 1,237<br />
1960-61 2,275 1,714 1,586 1,622 369 85 132 161 — 112 404 1,263<br />
1961-62 2,104 1,700 1,645 1,643 449 77 134 173 — 114 371 1,318<br />
1962-63 2,616 2,047 1,764 1,799 472 90 149 178 — 131 393 1,413<br />
1963-64 2,953 2,173 1,809 1,892 534 96 154 162 — 127 434 1,507<br />
1964-65 3,125 2,264 1,885 1,956 548 101 164 197 — 133 425 1,568<br />
1965-66 3,232 2,175 1,917 1,979 555 98 166 181 — 128 440 1,568<br />
1966-67 3,009 2,088 1,926 2,001 556 104 152 177 — 114 465 1,568<br />
1967-68 2,728 1,974 1,798 1,933 518 111 155 138 — 118 494 1,534<br />
1968-69 2,821 2,108 1,715 1,816 510 110 163 186 — 125 371 1,465<br />
1969-70 2,564 2,172 1,624 1,708 479 104 159 179 — 120 399 1,440<br />
1970-71 2,402 1,959 1,664 1,716 512 101 164 180 — 78 340 1,375<br />
1971-72 2,844 1,940 1,631 1,709 497 106 184 185 — 85 330 1,387<br />
1972-73 3,231 1,997 1,681 1,690 530 99 175 187 — 55 412 1,458<br />
1973-74 2,922 2,134 1,435 1,514 482 93 131 169 — 22 303 1,200<br />
1974-75 2,940 2,209 1,668 1,722 562 103 166 179 — 38 413 1,461<br />
1975-76 2,965 2,181 1,652 1,787 547 111 164 173 — 46 445 1,486<br />
1976-77 3,138 2,135 1,754 1,908 522 112 146 178 — 48 544 1,550<br />
1977-78 2,972 2,239 1,762 1,968 510 107 129 165 — 56 634 1,601<br />
1978-79 2,808 2,134 1,672 1,866 493 103 132 180 — 53 555 1,516<br />
1979-80 2,549 2,065 1,516 1,781 409 73 122 154 — 34 656 1,448<br />
1980-81 2,698 2,196 1,648 1,875 381 82 121 148 — 28 777 1,537<br />
1981-82 2,991 2,327 1,774 1,962 525 99 151 149 — 22 660 1,606<br />
1982-83 3,224 2,671 1,793 1,957 501 103 137 119 — 11 750 1,621<br />
1983-84 3,137 3,335 1,746 1,973 488 107 129 138 — 20 744 1,626<br />
1984-85 3,454 3,582 1,804 2,049 512 122 139 168 — 19 754 1,714<br />
1985-86 3,184 3,739 1,752 2,094 484 108 134 169 — 18 859 1,702<br />
1986-87 3,305 3,796 1,940 2,250 436 93 122 152 — 13 1,091 1,861<br />
1987-88 3,237 3,793 2,018 2,275 591 99 127 155 — 13 929 1,862<br />
1988-89 3,569 3,793 2,238 2,313 637 93 131 166 — 13 904 1,900<br />
1989-90 3,726 3,754 2,268 2,323 553 91 117 155 — 17 1,033 1,913<br />
1990-91 3,509 3,725 2,320 2,294 558 88 118 153 — 14 1,013 1,901<br />
1991-92 3,996 3,848 2,400 2,415 599 92 123 170 — 9 1,045 1,978<br />
1992-93 4,126 3,739 2,435 2,477 575 78 122 163 — 7 1,179 2,084<br />
1993-94 4,201 3,922 2,598 2,487 561 — 124 281 — 6 1,182 2,117<br />
1994-95 4,796 4,156 2,925 2,788 620 — 137 613 — 2 1,074 2,391<br />
1995-96 5,181 4,897 3,241 3,019 629 — 133 1,070 — — 869 2,660<br />
1996-97 5,766 5,294 3,440 3,106 666 — 114 1,228 — — 811 2,783<br />
1997-98 5,984 5,226 3,513 3,226 634 — 60 1,210 — — 1,105 2,971<br />
1998-99 6,056 5,137 3,626 3,264 622 — — 1,653 — — 835 3,051<br />
1999-2000 6,456 5,155 3,888 3,434 615 — — 2,057 — — 615 3,262<br />
2000-01 6,989 5,282 3,929 3,566 569 — — 1,858 356 — 647 3,413<br />
2001-02 7,335 5,636 4,041 3,749 680 — — 1,656 734 — 566 3,596<br />
2002-03 7,985 5,915 4,437 4,098 705 — — 1,563 1,110 — 563 3,975<br />
2003-04 8,445 5,842 4,466 4,224 694 — — 1,578 1,262 — 555 4,076<br />
2004-05 9,803 6,375 4,347 4,104 706 — — 1,354 1,445 — 604 4,074<br />
2005-06 10,834 6,521 5,177 4,731 821 — — 1,556 1,495 — 679 4,551<br />
<strong>2006</strong>-07 9,776 7,041 5,552 5,046 1,230 — — 1,670 1,523 — 506 4,929<br />
Notes :<br />
Figures of total saleable steel are adjusted for :<br />
(a) From 1985-86 and onwards - steel transferred to and produced at the Company’s Tubes Division.<br />
(b) Total saleable steel for 2003-04 includes production of the erstwhile <strong>Tata</strong> SSL Ltd., pursuant to its merger with the Company.