100th Annual Report 2006-2007 - Tata Steel
100th Annual Report 2006-2007 - Tata Steel
100th Annual Report 2006-2007 - Tata Steel

Create successful ePaper yourself
Turn your PDF publications into a flip-book with our unique Google optimized e-Paper software.
Management Discussion and Analysis<br />
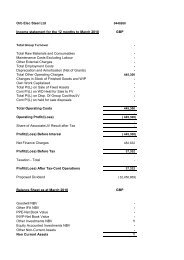
r) Appropriation<br />
The Company has transferred Rs. 1,500 crores to the General<br />
Reserve during FY <strong>2006</strong>-07 (FY 2005-06 : Rs. 1,500 crores).<br />
s) Dividend<br />
The Board of Directors of the Company have recommended<br />
a dividend @ 130% (Rs. 13 per share) for the year ended 31st<br />
March, <strong>2007</strong>, and a special dividend @ 25% (Rs. 2.50 per share),<br />
subject to the approval of the shareholders at the <strong>Annual</strong><br />
General Meeting. The dividend cash-outgo (including tax on<br />
dividend) would be Rs. 1,104.33 crores. The dividend payout<br />
as % of Net Profit works out to 26% as compared to 23% in the<br />
previous year. The dividend payout during the last 10 years is<br />
as illustrated below :<br />
t) EVA<br />
The Company in pursuance of its Vision to create value for<br />
its shareholders, has adopted the EVA based methodology<br />
for performance management and also for capital expenditure<br />
evaluation based on the recommendations of Stern Stewart<br />
& Co.<br />
Economic Value Added (EVA) is defined as the excess of Return<br />
on Invested Capital (ROIC) over weighted average cost of Capital<br />
(WACC); viz<br />
Return on Invested Capital (ROIC)<br />
= Net Operating Profit after Taxes but before interest costs<br />
(NOPAT)<br />
Average Invested Capital<br />
Weighted average cost of Capital (post tax)<br />
= Average Adjusted Equity * Cost of Equity (%) + Average debts<br />
(including Prov. for ESS Compensation and deferred tax liability)<br />
*Cost of Debts (%)<br />
Average Adjusted Equity + Average debts<br />
The Cost of Equity is determined under the CAPM method while<br />
the cost of debt is based on the actual cost of borrowings.<br />
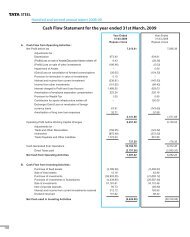
The EVA spread was 22.23% as compared to 23.54% in the<br />
previous year. The calculation of EVA spread is as follows:<br />
Particulars FY <strong>2006</strong>-07 FY 2005-06 Change<br />
Return on Invested Capital 32.64% 34.99% (2.35)%<br />
Weighted Average cost of<br />
Capital<br />
10.41% 11.45% (1.04)%<br />
EVA Spread (%) 22.23% 23.54% (1.33)%<br />
EVA - Rs. crores 2,707 2,324 383<br />
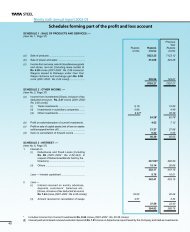
Average Dividend Payout : 28% of Net Profit<br />
Rs. crores<br />
1200<br />
180<br />
1000<br />
155%<br />
130% 130% 1104<br />
160<br />
140<br />
800<br />
600<br />
72%<br />
80%<br />
100%<br />
821 820<br />
120<br />
100<br />
80<br />
400<br />
200<br />
50% 58%<br />
40% 40%<br />
162 163<br />
50%<br />
40%<br />
40%<br />
37%<br />
39%<br />
164 205 147<br />
333<br />
33%<br />
416<br />
24% 24% 23% 26%<br />
60<br />
40<br />
20<br />
0<br />
'98<br />
'99<br />
'00<br />
'01<br />
'02<br />
'03<br />
'04<br />
'05<br />
'06<br />
'07<br />
0<br />
106<br />
Dividend incl. Tax (Rs. crores) Dividend (%) Dividend payout (%)