Global Education Digest 2012 - International Reading Association
Global Education Digest 2012 - International Reading Association
Global Education Digest 2012 - International Reading Association

Create successful ePaper yourself
Turn your PDF publications into a flip-book with our unique Google optimized e-Paper software.
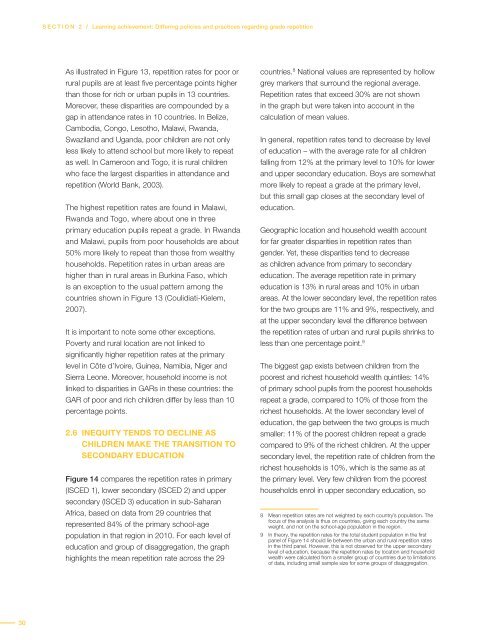
SECTION 2 / Learning achievement: Differing policies and practices regarding grade repetition<br />
As illustrated in Figure 13, repetition rates for poor or<br />
rural pupils are at least five percentage points higher<br />
than those for rich or urban pupils in 13 countries.<br />
Moreover, these disparities are compounded by a<br />
gap in attendance rates in 10 countries. In Belize,<br />
Cambodia, Congo, Lesotho, Malawi, Rwanda,<br />
Swaziland and Uganda, poor children are not only<br />
less likely to attend school but more likely to repeat<br />
as well. In Cameroon and Togo, it is rural children<br />
who face the largest disparities in attendance and<br />
repetition (World Bank, 2003).<br />
The highest repetition rates are found in Malawi,<br />
Rwanda and Togo, where about one in three<br />
primary education pupils repeat a grade. In Rwanda<br />
and Malawi, pupils from poor households are about<br />
50% more likely to repeat than those from wealthy<br />
households. Repetition rates in urban areas are<br />
higher than in rural areas in Burkina Faso, which<br />
is an exception to the usual pattern among the<br />
countries shown in Figure 13 (Coulidiati-Kielem,<br />
2007).<br />
It is important to note some other exceptions.<br />
Poverty and rural location are not linked to<br />
significantly higher repetition rates at the primary<br />
level in Côte d’Ivoire, Guinea, Namibia, Niger and<br />
Sierra Leone. Moreover, household income is not<br />
linked to disparities in GARs in these countries: the<br />
GAR of poor and rich children differ by less than 10<br />
percentage points.<br />
2.6 INEQUITY TENDS TO DECLINE AS<br />
CHILDREN MAKE THE TRANSITION TO<br />
SECONDARY EDUCATION<br />
Figure 14 compares the repetition rates in primary<br />
(ISCED 1), lower secondary (ISCED 2) and upper<br />
secondary (ISCED 3) education in sub-Saharan<br />
Africa, based on data from 29 countries that<br />
represented 84% of the primary school-age<br />
population in that region in 2010. For each level of<br />
education and group of disaggregation, the graph<br />
highlights the mean repetition rate across the 29<br />
countries. 8 National values are represented by hollow<br />
grey markers that surround the regional average.<br />
Repetition rates that exceed 30% are not shown<br />
in the graph but were taken into account in the<br />
calculation of mean values.<br />
In general, repetition rates tend to decrease by level<br />
of education – with the average rate for all children<br />
falling from 12% at the primary level to 10% for lower<br />
and upper secondary education. Boys are somewhat<br />
more likely to repeat a grade at the primary level,<br />
but this small gap closes at the secondary level of<br />
education.<br />
Geographic location and household wealth account<br />
for far greater disparities in repetition rates than<br />
gender. Yet, these disparities tend to decrease<br />
as children advance from primary to secondary<br />
education. The average repetition rate in primary<br />
education is 13% in rural areas and 10% in urban<br />
areas. At the lower secondary level, the repetition rates<br />
for the two groups are 11% and 9%, respectively, and<br />
at the upper secondary level the difference between<br />
the repetition rates of urban and rural pupils shrinks to<br />
less than one percentage point. 9<br />
The biggest gap exists between children from the<br />
poorest and richest household wealth quintiles: 14%<br />
of primary school pupils from the poorest households<br />
repeat a grade, compared to 10% of those from the<br />
richest households. At the lower secondary level of<br />
education, the gap between the two groups is much<br />
smaller: 11% of the poorest children repeat a grade<br />
compared to 9% of the richest children. At the upper<br />
secondary level, the repetition rate of children from the<br />
richest households is 10%, which is the same as at<br />
the primary level. Very few children from the poorest<br />
households enrol in upper secondary education, so<br />
8 Mean repetition rates are not weighted by each country’s population. The<br />
focus of the analysis is thus on countries, giving each country the same<br />
weight, and not on the school-age population in the region.<br />
9 In theory, the repetition rates for the total student population in the first<br />
panel of Figure 14 should lie between the urban and rural repetition rates<br />
in the third panel. However, this is not observed for the upper secondary<br />
level of education, because the repetition rates by location and household<br />
wealth were calculated from a smaller group of countries due to limitations<br />
of data, including small sample size for some groups of disaggregation.<br />
30