- Page 1:
PREPARED FOR: ARIZONA PUBLIC SERVIC
- Page 5 and 6:
CONTENTS List of Tables............
- Page 7 and 8:
Contents 5. Technical Value - Power
- Page 9 and 10:
Contents TABLES 1-1 RES Eligible Te
- Page 11 and 12:
Contents FIGURES 1-1 RES Compliance
- Page 13 and 14:
5-6 Typical Output, Single-Axis Tra
- Page 15 and 16:
EXECUTIVE SUMMARY Abundant sunshine
- Page 17 and 18:
Executive Summary many uncertaintie
- Page 19 and 20:
Executive Summary In contrast to al
- Page 21 and 22:
Executive Summary Capital Reduction
- Page 23 and 24:
Executive Summary Annual Energy and
- Page 25 and 26:
Executive Summary commercial custom
- Page 27 and 28:
Executive Summary Creation of a suc
- Page 29 and 30:
SECTION 1 — STUDY BACKGROUND AND
- Page 31 and 32:
Study Background and Description 1.
- Page 33 and 34:
Study Background and Description in
- Page 35 and 36:
Study Background and Description Fi
- Page 37 and 38:
Study Background and Description SH
- Page 39 and 40:
Study Background and Description Ta
- Page 41 and 42:
Study Background and Description Fi
- Page 43 and 44:
Study Background and Description 1.
- Page 45 and 46:
Study Background and Description AP
- Page 47 and 48:
Study Background and Description cu
- Page 49 and 50:
Study Background and Description Fi
- Page 51 and 52:
Study Background and Description to
- Page 53:
Study Background and Description in
- Page 56 and 57:
Section 2 and commercial customers.
- Page 58 and 59:
Section 2 Figure 2-2: Photovoltaic
- Page 60 and 61:
Section 2 When weighted by capacity
- Page 62 and 63:
Section 2 PV Model Inputs Two basel
- Page 64 and 65:
Section 2 Figure 2-5: Phoenix Area
- Page 66 and 67:
Section 2 Figure 2-7: Typical Sprin
- Page 68 and 69:
Section 2 account shading at the ho
- Page 70 and 71:
Section 2 • Residential: • A so
- Page 72 and 73:
Section 2 • Thermosyphon systems
- Page 74 and 75:
Section 2 existing systems installe
- Page 76 and 77:
Section 2 Figure 2-12: Hourly SHW S
- Page 78 and 79:
Section 2 Figure 2-14: Active Dayli
- Page 80 and 81:
Section 2 Daylighting Costs Capital
- Page 82 and 83:
Section 2 • An interior diffusion
- Page 84 and 85:
Section 2 Key Findings of Commercia
- Page 86 and 87:
Section 2 2.5 Deployment Analysis 2
- Page 88 and 89:
Section 2 Table 2-11 Residential PV
- Page 90 and 91:
Section 2 Commercial PV PV systems
- Page 92 and 93:
Section 2 was conceived by Frank Ba
- Page 94 and 95:
Section 2 Kastovich. 36 The formula
- Page 96 and 97:
Section 2 Figure 2-20: PV Payback -
- Page 98 and 99:
Section 2 Figure 2-22: PV Payback -
- Page 100 and 101:
Section 2 Figure 2-24: Daylighting
- Page 102 and 103:
Section 2 • The forecast of the a
- Page 104 and 105:
Section 2 Results of Market Simulat
- Page 107 and 108:
SECTION 3 — TECHNICAL VALUE - DIS
- Page 109 and 110:
Technical Value - Distribution Syst
- Page 111 and 112:
Technical Value - Distribution Syst
- Page 113 and 114:
Technical Value - Distribution Syst
- Page 115 and 116:
Technical Value - Distribution Syst
- Page 117 and 118:
Technical Value - Distribution Syst
- Page 119 and 120:
Technical Value - Distribution Syst
- Page 121 and 122:
Technical Value - Distribution Syst
- Page 123 and 124:
Technical Value - Distribution Syst
- Page 125 and 126:
Technical Value - Distribution Syst
- Page 127 and 128:
Technical Value - Distribution Syst
- Page 129 and 130:
Technical Value - Distribution Syst
- Page 131 and 132:
Technical Value - Distribution Syst
- Page 133 and 134:
Technical Value - Distribution Syst
- Page 135 and 136:
Technical Value - Distribution Syst
- Page 137 and 138:
Technical Value - Distribution Syst
- Page 139:
Technical Value - Distribution Syst
- Page 142 and 143:
Section 4 Both of these benefits ar
- Page 144 and 145:
Section 4 decrease both real and re
- Page 146 and 147:
Section 4 • A simplifying assumpt
- Page 148 and 149:
Section 4 Results The effects of as
- Page 150 and 151:
Section 4 may have excess schedulin
- Page 152 and 153: Section 4 4.3.2 Local Reliability/R
- Page 154 and 155: Section 4 Figure 4-3: $110 Million
- Page 156 and 157: Section 4 Figure 4-4: Historical PV
- Page 158 and 159: Section 4 Figure 4-6: Historical PV
- Page 161 and 162: SECTION 5 — TECHNICAL VALUE - POW
- Page 163 and 164: Technical Value - Power Supply Capa
- Page 165 and 166: Technical Value - Power Supply Capa
- Page 167 and 168: Technical Value - Power Supply Capa
- Page 169 and 170: Technical Value - Power Supply Capa
- Page 171 and 172: Technical Value - Power Supply Capa
- Page 173 and 174: Technical Value - Power Supply Capa
- Page 175 and 176: Technical Value - Power Supply Capa
- Page 177 and 178: Technical Value - Power Supply Capa
- Page 179 and 180: Technical Value - Power Supply Capa
- Page 181 and 182: Technical Value - Power Supply Capa
- Page 183 and 184: Technical Value - Power Supply Capa
- Page 185 and 186: Technical Value - Power Supply Capa
- Page 187: Technical Value - Power Supply Capa
- Page 190 and 191: Section 6 Value is also viewed and
- Page 192 and 193: Section 6 6.2.2 Approach to Identif
- Page 194 and 195: Section 6 Table 6-1 Levelized Carry
- Page 196 and 197: Section 6 6.4.2 Summary of Quantita
- Page 198 and 199: Section 6 Table 6-4 Capital Cost Re
- Page 200 and 201: Section 6 Table 6-6 Total Solar DE
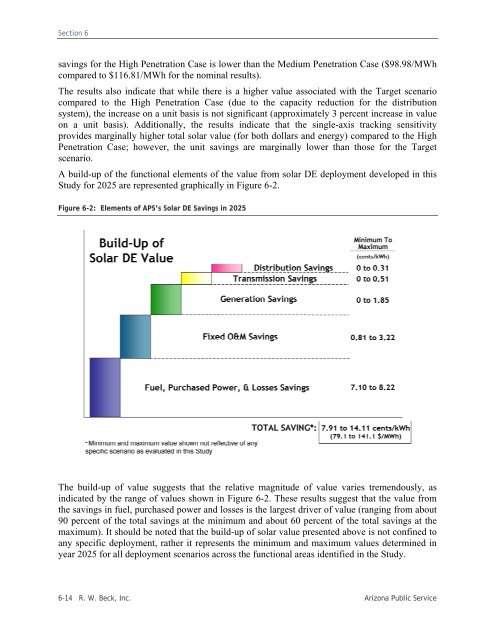
- Page 204 and 205: Section 6 6.4.7 Fixed and Variable
- Page 206 and 207: Section 6 current demand, but assum
- Page 208 and 209: Section 6 legislation and regulatio
- Page 210 and 211: Section 6 The expansion of “green
- Page 212 and 213: Section 6 solar DE development over
- Page 214 and 215: Section 6 • Provide financing - M
- Page 216 and 217: Section 6 6.8 Conclusions The winni
- Page 218 and 219: Appendix A solar incidence: solar t
- Page 221 and 222: APPENDIX B — CALIFORNIA PV PROGRA
- Page 223 and 224: CALIFORNIA PV PROGRAM Figure B-2. C
- Page 225 and 226: CALIFORNIA PV PROGRAM largest avera
- Page 227 and 228: CALIFORNIA PV PROGRAM The data show
- Page 229 and 230: CALIFORNIA PV PROGRAM The following
- Page 231: CALIFORNIA PV PROGRAM Figure B-6. H
- Page 234 and 235: Appendix C The price of an SREC is
- Page 236 and 237: Appendix C Figure C-3. Average Cost
- Page 238 and 239: Appendix C Figure C-6. Average Cost
- Page 240 and 241: Appendix C C.2.5 Government Facilit
- Page 242 and 243: Appendix C Figure C-14. Average Cap
- Page 244 and 245: Appendix C Figure C-16. Total Numbe
- Page 247 and 248: APPENDIX D — CUSTOMER USE CHARACT
- Page 249 and 250: Customer Use Characteristics by Sel
- Page 251 and 252: Customer Use Characteristics by Sel
- Page 253 and 254:
Customer Use Characteristics by Sel
- Page 255 and 256:
Customer Use Characteristics by Sel
- Page 257 and 258:
Customer Use Characteristics by Sel
- Page 259 and 260:
APPENDIX E — MONTHLY LOAD PROFILE
- Page 261 and 262:
Monthly Load Profiles by Selected A
- Page 263 and 264:
Monthly Load Profiles by Selected A
- Page 265 and 266:
Monthly Load Profiles by Selected A
- Page 267 and 268:
Monthly Load Profiles by Selected A
- Page 269 and 270:
Monthly Load Profiles by Selected A
- Page 271 and 272:
Monthly Load Profiles by Selected A
- Page 273 and 274:
Monthly Load Profiles by Selected A
- Page 275 and 276:
Monthly Load Profiles by Selected A
- Page 277 and 278:
Monthly Load Profiles by Selected A
- Page 279 and 280:
Monthly Load Profiles by Selected A
- Page 281 and 282:
Monthly Load Profiles by Selected A
- Page 283 and 284:
Monthly Load Profiles by Selected A
- Page 285 and 286:
Monthly Load Profiles by Selected A
- Page 287 and 288:
Monthly Load Profiles by Selected A
- Page 289 and 290:
APPENDIX F — PHOTOVOLTAIC SYSTEM
- Page 291 and 292:
Photovoltaic system modeling Figure
- Page 293:
Photovoltaic system modeling - One-
- Page 296 and 297:
Appendix G The SRCC provides estima
- Page 298 and 299:
Appendix H Equipment Qualifications
- Page 300 and 301:
Appendix I Table I-3 Residential Ch
- Page 303:
Appendix J APS Incentive Schedules
- Page 306 and 307:
DISTRIBUTED ENERGY ADMINISTRATION P
- Page 308 and 309:
DISTRIBUTED ENERGY ADMINISTRATION P
- Page 311:
Appendix K DSS Study - Distribution
- Page 314 and 315:
Overview • EPRI was contracted by
- Page 316 and 317:
Circuit Model © 2008 Electric Powe
- Page 318 and 319:
Modeling Assumptions • Distributi
- Page 320 and 321:
Procedures After Model Conversion
- Page 322 and 323:
Load Models • Individual customer
- Page 324 and 325:
Loss Impact Analysis © 2008 Electr
- Page 326 and 327:
Sample Residential Solar Curves 3.0
- Page 328 and 329:
Hourly Average Load and Solar Curve
- Page 330 and 331:
Base Case Results: No Solar 12000 T
- Page 332 and 333:
Case 1 Results: Business as Usual 1
- Page 334 and 335:
Loss Analysis Results Summary Base
- Page 336 and 337:
Reduction in 2007 Peak Load 2007 Pe
- Page 338 and 339:
Voltage Regulation © 2008 Electric
- Page 340 and 341:
ADEQ: Fixed Horizontal commercial P
- Page 342 and 343:
SOL_Desert: Fixed Latitude (residen
- Page 344 and 345:
Voltage Regulation Model • Same b
- Page 346 and 347:
Total PV Power Input Total PV Power
- Page 348 and 349:
Effect of PV Power on Phase Current
- Page 350 and 351:
Deviation between Voltage Profile 0
- Page 352 and 353:
Greenfield Results with Manually Ed
- Page 354 and 355:
Effect of Edited PV Profile on Tota
- Page 356 and 357:
Effect of Edited PV Profile on Volt
- Page 359 and 360:
APPENDIX L — MODEL RESULTS Figure
- Page 361 and 362:
Model Results Figure L-5. Residenti
- Page 363 and 364:
Model Results Figure L-9. Residenti
- Page 365 and 366:
Model Results Figure L-13. Resident
- Page 367 and 368:
Model Results Figure L-17. Resident
- Page 369 and 370:
Model Results Figure L-21. Commerci
- Page 371 and 372:
Model Results Figure L-25. Commerci
- Page 373 and 374:
Model Results Figure L-29. Large Co
- Page 375 and 376:
Model Results Figure L-33. Solar Ho
- Page 377 and 378:
Model Results Figure L-37. Solar Ho
- Page 379 and 380:
Model Results Figure L-41. Solar Ho
- Page 381 and 382:
Model Results Figure L-45. Solar Ho
- Page 383 and 384:
Model Results Figure L-49. Cactus A
- Page 385 and 386:
Model Results Figure L-53. East Val
- Page 387 and 388:
Model Results Figure L-57. East Val
- Page 389 and 390:
Model Results Figure L-61. Galvin P
- Page 391 and 392:
Model Results Figure L-65. Javalina
- Page 393 and 394:
Model Results Figure L-69. Pioneer
- Page 395 and 396:
Model Results Figure L-73. Thompson
- Page 397:
Model Results Figure L-77. DE Impac
- Page 400 and 401:
Appendix M Figure M-2. Power Factor
- Page 402 and 403:
Appendix M Table M-1 Data Points fo
- Page 404 and 405:
Appendix M Figure M-6. Zoomed Plot
- Page 406 and 407:
Appendix M Figure M-10. Plot of Tra
- Page 408 and 409:
Appendix M • I harmonic number: 3
- Page 410 and 411:
Appendix M • File ending: Bad •
- Page 412 and 413:
Appendix M Table M-7 Limit Setups V
- Page 415:
Appendix N Evaluation of Economic V
- Page 418 and 419:
Appendix N N.3 Economic Value of Ca
- Page 420 and 421:
Distributed Renewable Energy Operat
- Page 422 and 423:
Calculation of APS Carrying Charges
- Page 424:
Calculation of APS Carrying Charges


