Annual report 2010 - plazacenters
Annual report 2010 - plazacenters
Annual report 2010 - plazacenters

You also want an ePaper? Increase the reach of your titles
YUMPU automatically turns print PDFs into web optimized ePapers that Google loves.
O<br />
Br<br />
Mg<br />
Fs<br />
Ai<br />
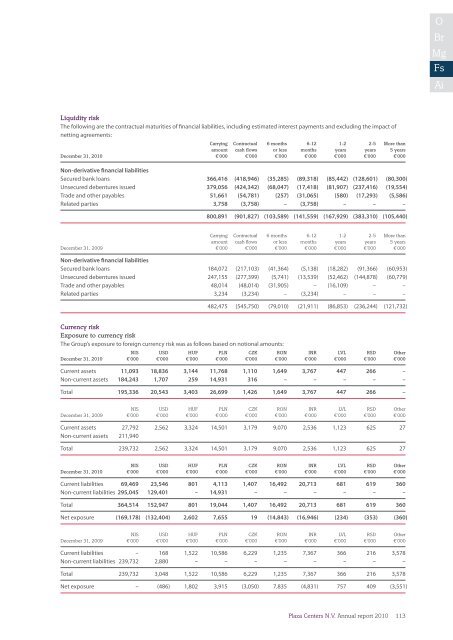
Liquidity risk<br />
The following are the contractual maturities of financial liabilities, including estimated interest payments and excluding the impact of<br />
netting agreements:<br />
Carrying Contractual 6 months 6-12 1-2 2-5 More than<br />
amount cash flows or less months years years 5 years<br />
December 31, <strong>2010</strong> €’000 €’000 €’000 €’000 €’000 €’000 €’000<br />
Non-derivative financial liabilities<br />
Secured bank loans 366,416 (418,946) (35,285) (89,318) (85,442) (128,601) (80,300)<br />
Unsecured debentures issued 379,056 (424,342) (68,047) (17,418) (81,907) (237,416) (19,554)<br />
Trade and other payables 51,661 (54,781) (257) (31,065) (580) (17,293) (5,586)<br />
Related parties 3,758 (3,758) – (3,758) – – –<br />
800,891 (901,827) (103,589) (141,559) (167,929) (383,310) (105,440)<br />
Carrying Contractual 6 months 6-12 1-2 2-5 More than<br />
amount cash flows or less months years years 5 years<br />
December 31, 2009 €’000 €’000 €’000 €’000 €’000 €’000 €’000<br />
Non-derivative financial liabilities<br />
Secured bank loans 184,072 (217,103) (41,364) (5,138) (18,282) (91,366) (60,953)<br />
Unsecured debentures issued 247,155 (277,399) (5,741) (13,539) (52,462) (144,878) (60,779)<br />
Trade and other payables 48,014 (48,014) (31,905) – (16,109) – –<br />
Related parties 3,234 (3,234) – (3,234) – – –<br />
482,475 (545,750) (79,010) (21,911) (86,853) (236,244) (121,732)<br />
Currency risk<br />
Exposure to currency risk<br />
The Group’s exposure to foreign currency risk was as follows based on notional amounts:<br />
NIS USD HUF PLN CZK RON INR LVL RSD Other<br />
December 31, <strong>2010</strong> €’000 €’000 €’000 €’000 €’000 €’000 €’000 €’000 €’000 €’000<br />
Current assets 11,093 18,836 3,144 11,768 1,110 1,649 3,767 447 266 –<br />
Non-current assets 184,243 1,707 259 14,931 316 – – – – –<br />
Total 195,336 20,543 3,403 26,699 1,426 1,649 3,767 447 266 –<br />
NIS USD HUF PLN CZK RON INR LVL RSD Other<br />
December 31, 2009 €’000 €’000 €’000 €’000 €’000 €’000 €’000 €’000 €’000 €’000<br />
Current assets 27,792 2,562 3,324 14,501 3,179 9,070 2,536 1,123 625 27<br />
Non-current assets 211,940<br />
Total 239,732 2,562 3,324 14,501 3,179 9,070 2,536 1,123 625 27<br />
NIS USD HUF PLN CZK RON INR LVL RSD Other<br />
December 31, <strong>2010</strong> €’000 €’000 €’000 €’000 €’000 €’000 €’000 €’000 €’000 €’000<br />
Current liabilities 69,469 23,546 801 4,113 1,407 16,492 20,713 681 619 360<br />
Non-current liabilities 295,045 129,401 – 14,931 – – – – – –<br />
Total 364,514 152,947 801 19,044 1,407 16,492 20,713 681 619 360<br />
Net exposure (169,178) (132,404) 2,602 7,655 19 (14,843) (16,946) (234) (353) (360)<br />
NIS USD HUF PLN CZK RON INR LVL RSD Other<br />
December 31, 2009 €’000 €’000 €’000 €’000 €’000 €’000 €’000 €’000 €’000 €’000<br />
Current liabilities – 168 1,522 10,586 6,229 1,235 7,367 366 216 3,578<br />
Non-current liabilities 239,732 2,880 – – – – – – – –<br />
Total 239,732 3,048 1,522 10,586 6,229 1,235 7,367 366 216 3,578<br />
Net exposure – (486) 1,802 3,915 (3,050) 7,835 (4,831) 757 409 (3,551)<br />
<br />
Plaza Centers N.V. <strong>Annual</strong> <strong>report</strong> <strong>2010</strong>113