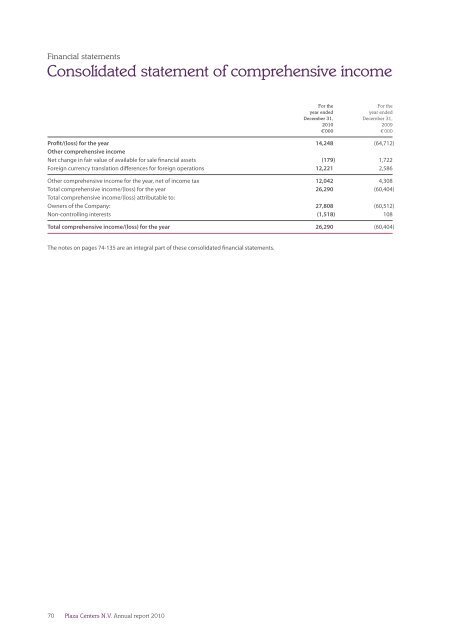
Financial statements Consolidated statement of comprehensive income For the For the year ended year ended December 31, December 31, <strong>2010</strong> 2009 €’000 €’000 Profit/(loss) for the year 14,248 (64,712) Other comprehensive income Net change in fair value of available for sale financial assets (179) 1,722 Foreign currency translation differences for foreign operations 12,221 2,586 Other comprehensive income for the year, net of income tax 12,042 4,308 Total comprehensive income/(loss) for the year 26,290 (60,404) Total comprehensive income/(loss) attributable to: Owners of the Company: 27,808 (60,512) Non-controlling interests (1,518) 108 Total comprehensive income/(loss) for the year 26,290 (60,404) The notes on pages 74-135 are an integral part of these consolidated financial statements. 70 Plaza Centers N.V. <strong>Annual</strong> <strong>report</strong> <strong>2010</strong>
Financial statements Consolidated statement of changes in equity O Br Mg Fs Ai Attributable to the equity holders of the Company Financial assets Other Reserve available Non- Share Share capital Translation for own for sale Retained controlling capital premium reserves reserve shares reserve earnings Total interest Total €’000 €’000 €’000 €’000 €’000 €’000 €’000 €’000 €’000 €’000 Balance at December 31, 2008 2,924 248,860 22,898 (12,175) (5,469) (1,120) 350,605 606,523 3,008 609,531 Own shares acquired – – – – (3,523) – – (3,523) – (3,523) Own shares sold – 12,913 – – 8,992 – – 21,905 – 21,905 Effect of acquisition of subsidiaries – – – – – – – – 1,794 1,794 Share-based payment – – 5,406 – – – – 5,406 – 5,406 Share option exercised 18 – (18) – – – – – – – Comprehensive income for the year Loss – – – – – – (64,769) (64,769) 57 (64,712) Foreign currency translation differences – – – 2,535 – – – 2,535 51 2,586 Available for sale reserve, net – – – – – 1,722 – 1,722 – 1,722 Total comprehensive income for the year – – – 2,535 – 1,722 (64,769) (60,512) 108 (60,404) Balance at December 31, 2009 2,942 261,773 28,286 (9,640) – 602 285,836 569,799 4,910 574,709 Effect of acquisition of subsidiaries – – – – – – – – 20,862 20,862 Share-based payment – – 2,588 – – – – 2,588 – 2,588 Share option exercised 25 – (25) – – – – – – – Comprehensive income for the year Profit – – – – – – 10,273 10,273 3,975 14,248 Foreign currency translation differences – – – 17,714 – – – 17,714 (5,493) 12,221 Available for sale reserve, net – – – – – (179) – (179) – (179) Total comprehensive income for the year – – – 17,714 – (179) 10,273 27,808 (1,518) 26,290 Balance at December 31, <strong>2010</strong> 2,967 261,773 30,849 8,074 – 423 296,109 600,195 24,254 624,449 The notes on pages 74-135 are an integral part of these consolidated financial statements. Plaza Centers N.V. <strong>Annual</strong> <strong>report</strong> <strong>2010</strong>71