Annual report 2010 - plazacenters
Annual report 2010 - plazacenters
Annual report 2010 - plazacenters

You also want an ePaper? Increase the reach of your titles
YUMPU automatically turns print PDFs into web optimized ePapers that Google loves.
O<br />
Br<br />
Mg<br />
Fs<br />
Ai<br />
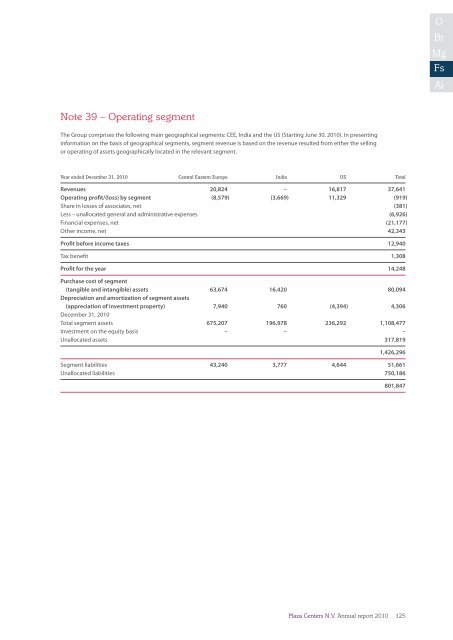
Note 39 – Operating segment<br />
The Group comprises the following main geographical segments: CEE, India and the US (Starting June 30, <strong>2010</strong>). In presenting<br />
information on the basis of geographical segments, segment revenue is based on the revenue resulted from either the selling<br />
or operating of assets geographically located in the relevant segment.<br />
Year ended December 31, <strong>2010</strong> Central Eastern Europe India US Total<br />
Revenues 20,824 – 16,817 37,641<br />
Operating profit/(loss) by segment (8,579) (3,669) 11,329 (919)<br />
Share in losses of associates, net (381)<br />
Less – unallocated general and administrative expenses (6,926)<br />
Financial expenses, net (21,177)<br />
Other income, net 42,343<br />
Profit before income taxes 12,940<br />
Tax benefit 1,308<br />
Profit for the year 14,248<br />
Purchase cost of segment<br />
(tangible and intangible) assets 63,674 16,420 80,094<br />
Depreciation and amortization of segment assets<br />
(appreciation of investment property) 7,940 760 (4,394) 4,306<br />
December 31, <strong>2010</strong><br />
Total segment assets 675,207 196,978 236,292 1,108,477<br />
Investment on the equity basis – – –<br />
Unallocated assets 317,819<br />
1,426,296<br />
Segment liabilities 43,240 3,777 4,644 51,661<br />
Unallocated liabilities 750,186<br />
801,847<br />
<br />
Plaza Centers N.V. <strong>Annual</strong> <strong>report</strong> <strong>2010</strong>125