Unit A Reproduction
Unit A Reproduction
Unit A Reproduction

Create successful ePaper yourself
Turn your PDF publications into a flip-book with our unique Google optimized e-Paper software.
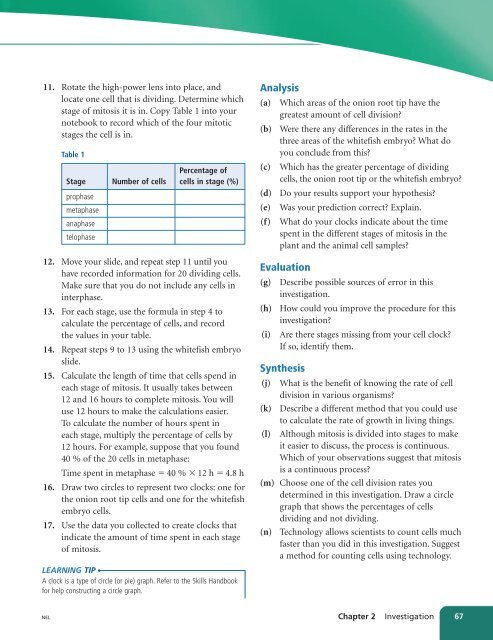
11. Rotate the high-power lens into place, and<br />
locate one cell that is dividing. Determine which<br />
stage of mitosis it is in. Copy Table 1 into your<br />
notebook to record which of the four mitotic<br />
stages the cell is in.<br />
Table 1<br />
Percentage of<br />
Stage Number of cells cells in stage (%)<br />
prophase<br />
metaphase<br />
anaphase<br />
telophase<br />
12. Move your slide, and repeat step 11 until you<br />
have recorded information for 20 dividing cells.<br />
Make sure that you do not include any cells in<br />
interphase.<br />
13. For each stage, use the formula in step 4 to<br />
calculate the percentage of cells, and record<br />
the values in your table.<br />
14. Repeat steps 9 to 13 using the whitefish embryo<br />
slide.<br />
15. Calculate the length of time that cells spend in<br />
each stage of mitosis. It usually takes between<br />
12 and 16 hours to complete mitosis. You will<br />
use 12 hours to make the calculations easier.<br />
To calculate the number of hours spent in<br />
each stage, multiply the percentage of cells by<br />
12 hours. For example, suppose that you found<br />
40 % of the 20 cells in metaphase:<br />
Time spent in metaphase 40 % 12 h 4.8 h<br />
16. Draw two circles to represent two clocks: one for<br />
the onion root tip cells and one for the whitefish<br />
embryo cells.<br />
17. Use the data you collected to create clocks that<br />
indicate the amount of time spent in each stage<br />
of mitosis.<br />
Analysis<br />
(a) Which areas of the onion root tip have the<br />
greatest amount of cell division?<br />
(b) Were there any differences in the rates in the<br />
three areas of the whitefish embryo? What do<br />
you conclude from this?<br />
(c) Which has the greater percentage of dividing<br />
cells, the onion root tip or the whitefish embryo?<br />
(d) Do your results support your hypothesis?<br />
(e) Was your prediction correct? Explain.<br />
(f) What do your clocks indicate about the time<br />
spent in the different stages of mitosis in the<br />
plant and the animal cell samples?<br />
Evaluation<br />
(g) Describe possible sources of error in this<br />
investigation.<br />
(h) How could you improve the procedure for this<br />
investigation?<br />
(i) Are there stages missing from your cell clock?<br />
If so, identify them.<br />
Synthesis<br />
(j) What is the benefit of knowing the rate of cell<br />
division in various organisms?<br />
(k) Describe a different method that you could use<br />
to calculate the rate of growth in living things.<br />
(l) Although mitosis is divided into stages to make<br />
it easier to discuss, the process is continuous.<br />
Which of your observations suggest that mitosis<br />
is a continuous process?<br />
(m) Choose one of the cell division rates you<br />
determined in this investigation. Draw a circle<br />
graph that shows the percentages of cells<br />
dividing and not dividing.<br />
(n) Technology allows scientists to count cells much<br />
faster than you did in this investigation. Suggest<br />
a method for counting cells using technology.<br />
LEARNING TIP<br />
A clock is a type of circle (or pie) graph. Refer to the Skills Handbook<br />
for help constructing a circle graph.<br />
NEL<br />
Chapter 2 Investigation 67