Climate change futures: health, ecological and economic dimensions
Climate change futures: health, ecological and economic dimensions
Climate change futures: health, ecological and economic dimensions

You also want an ePaper? Increase the reach of your titles
YUMPU automatically turns print PDFs into web optimized ePapers that Google loves.
(also known as “cash-flow underwriting”). As occurred<br />
after the European windstorms of 1999 (ABI 2004),<br />
insurers encounter liquidity problems when paying losses,<br />
forcing the sale of large blocks of securities,<br />
which, in turn, creates undesirable “knock-on” impacts<br />
in the broader financial markets. Outcomes are particularly<br />
bad in years when large catastrophe losses coincide<br />
with financial market downturns.<br />
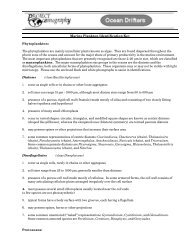
Most significantly impacted are insurance operations in<br />
the developing world <strong>and</strong> economies in transition (the<br />
primary growth markets for insurance — see figure<br />
3.4), already generating nearly US $400 billion/year<br />
in premiums. This arises from a combination of inferior<br />
disaster preparedness <strong>and</strong> recovery capacity, more<br />
vulnerable infrastructure due to the lack or non-enforcement<br />
of building codes, high dependency on coastal<br />
<strong>and</strong> agricultural <strong>economic</strong> activities, <strong>and</strong> a shortage of<br />
funds to invest in disaster-resilient adaptation projects<br />
(Mills 2004). Insurers from industrialized countries<br />
increasingly share these losses via their growing<br />
expansion into these emerging markets.<br />
In the face of the aforementioned trends, insurers use<br />
traditional methods to reduce their exposures:<br />
increased premiums <strong>and</strong> deductibles, lowered limits,<br />
non-renewals, <strong>and</strong> new exclusions. While consumer<br />
Figure 3.4<br />
Non-life insurance<br />
25%<br />
Life insurance<br />
25%<br />
avg. 13.3%<br />
20%<br />
20%<br />
15%<br />
10%<br />
5%<br />
0%<br />
-5%<br />
80<br />
82<br />
Emerging markets<br />
84<br />
Industrialized countries<br />
Insurance in emerging <strong>and</strong> industrialized markets.<br />
Source: Swiss Re 2000, sigma 4/2000<br />
86<br />
88<br />
90<br />
92<br />
94<br />
avg. 7.2%<br />
avg. 3.2%<br />
96<br />
98<br />
15%<br />
10%<br />
5%<br />
0%<br />
-5% 80 82<br />
Emerging markets<br />
84<br />
86<br />
avg. 6.7%<br />
88 90 92 94 96 98<br />
Industrialized countries<br />
99 | FINANCIAL IMPLICATIONS<br />
Figure 3.5<br />
Non-life insurance<br />
Life insurance<br />
Asia<br />
Asia<br />
Latin America<br />
Latin America<br />
Central <strong>and</strong> Eastern Europe<br />
Central <strong>and</strong> Eastern Europe<br />
20% 40% 60% 80% 100%<br />
20% 40% 60% 80% 100%<br />
Foreign majority shareholding<br />
Foreign minority shareholding<br />
Foreign participation in ownership is important in the insurance market<br />
Source: Swiss Re 2000, sigma 4/2000