MPED-X-Routing-Tender20080721 - Madhya Pradesh State Excise
MPED-X-Routing-Tender20080721 - Madhya Pradesh State Excise
MPED-X-Routing-Tender20080721 - Madhya Pradesh State Excise
You also want an ePaper? Increase the reach of your titles
YUMPU automatically turns print PDFs into web optimized ePapers that Google loves.
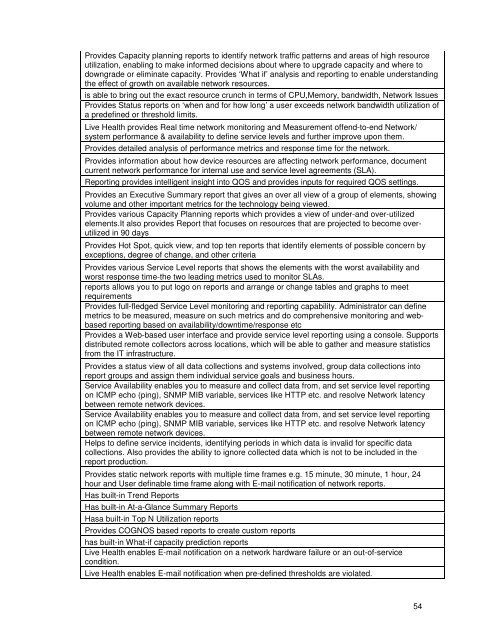
Provides Capacity planning reports to identify network traffic patterns and areas of high resource<br />
utilization, enabling to make informed decisions about where to upgrade capacity and where to<br />
downgrade or eliminate capacity. Provides ‘What if’ analysis and reporting to enable understanding<br />
the effect of growth on available network resources.<br />
is able to bring out the exact resource crunch in terms of CPU,Memory, bandwidth, Network Issues<br />
Provides Status reports on ‘when and for how long’ a user exceeds network bandwidth utilization of<br />
a predefined or threshold limits.<br />
Live Health provides Real time network monitoring and Measurement offend-to-end Network/<br />
system performance & availability to define service levels and further improve upon them.<br />
Provides detailed analysis of performance metrics and response time for the network.<br />
Provides information about how device resources are affecting network performance, document<br />
current network performance for internal use and service level agreements (SLA).<br />
Reporting provides intelligent insight into QOS and provides inputs for required QOS settings.<br />
Provides an Executive Summary report that gives an over all view of a group of elements, showing<br />
volume and other important metrics for the technology being viewed.<br />
Provides various Capacity Planning reports which provides a view of under-and over-utilized<br />
elements.It also provides Report that focuses on resources that are projected to become overutilized<br />
in 90 days<br />
Provides Hot Spot, quick view, and top ten reports that identify elements of possible concern by<br />
exceptions, degree of change, and other criteria<br />
Provides various Service Level reports that shows the elements with the worst availability and<br />
worst response time-the two leading metrics used to monitor SLAs.<br />
reports allows you to put logo on reports and arrange or change tables and graphs to meet<br />
requirements<br />
Provides full-fledged Service Level monitoring and reporting capability. Administrator can define<br />
metrics to be measured, measure on such metrics and do comprehensive monitoring and webbased<br />
reporting based on availability/downtime/response etc<br />
Provides a Web-based user interface and provide service level reporting using a console. Supports<br />
distributed remote collectors across locations, which will be able to gather and measure statistics<br />
from the IT infrastructure.<br />
Provides a status view of all data collections and systems involved, group data collections into<br />
report groups and assign them individual service goals and business hours.<br />
Service Availability enables you to measure and collect data from, and set service level reporting<br />
on ICMP echo (ping), SNMP MIB variable, services like HTTP etc. and resolve Network latency<br />
between remote network devices.<br />
Service Availability enables you to measure and collect data from, and set service level reporting<br />
on ICMP echo (ping), SNMP MIB variable, services like HTTP etc. and resolve Network latency<br />
between remote network devices.<br />
Helps to define service incidents, identifying periods in which data is invalid for specific data<br />
collections. Also provides the ability to ignore collected data which is not to be included in the<br />
report production.<br />
Provides static network reports with multiple time frames e.g. 15 minute, 30 minute, 1 hour, 24<br />
hour and User definable time frame along with E-mail notification of network reports.<br />
Has built-in Trend Reports<br />
Has built-in At-a-Glance Summary Reports<br />
Hasa built-in Top N Utilization reports<br />
Provides COGNOS based reports to create custom reports<br />
has built-in What-if capacity prediction reports<br />
Live Health enables E-mail notification on a network hardware failure or an out-of-service<br />
condition.<br />
Live Health enables E-mail notification when pre-defined thresholds are violated.<br />
54


![vkcdkjh vk;qDr] e/;izns”k] Xokfy;j dk;kZy; vkcdkjh vk;qDr] e/;izns”k ...](https://img.yumpu.com/46609233/1/190x245/vkcdkjh-vkqdr-e-iznsk-xokfyj-dkkzy-vkcdkjh-vkqdr-e-iznsk-.jpg?quality=85)

![Page 1 wim 55] 3mm, WR, femm' 3 W13 2012-1151 14, 1s1§1933 ...](https://img.yumpu.com/43206412/1/178x260/page-1-wim-55-3mm-wr-femm-3-w13-2012-1151-14-1s11933-.jpg?quality=85)