- Page 1 and 2:
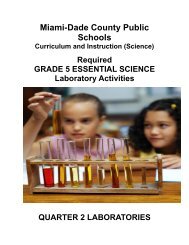
Curriculum and Instruction Division
- Page 3 and 4:
Table of Contents Introduction ....
- Page 5 and 6:
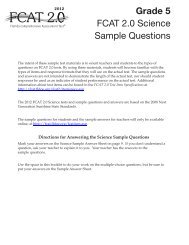
Introduction The purpose of this do
- Page 7 and 8:
7. SC.912.L.15.1: Explain how the s
- Page 9 and 10:
16. SC.912.L.17.5: Analyze how popu
- Page 11 and 12:
to the norms and conventions of the
- Page 13 and 14:
Materials Hands-on Activities 1. Pe
- Page 15 and 16:
15. Cellular Respiration Distilled
- Page 17 and 18:
30. Enzyme Catalyst Lab Yeast solut
- Page 19 and 20:
Laboratory Safety Rules: Know the p
- Page 21 and 22:
Writing in Science A report is a re
- Page 23 and 24:
Hands-on Activities
- Page 25 and 26:
Teacher During activity: After acti
- Page 27 and 28:
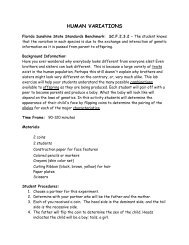
Student Materials: Procedures: Usin
- Page 29 and 30:
Student Data: Name Actual Height Fe
- Page 31 and 32:
Teacher them also describe importan
- Page 33 and 34:
Student Materials (per group): 4 st
- Page 35 and 36:
Student Data Analysis: Create a ske
- Page 37 and 38:
Teacher After activity: d. Remind s
- Page 39 and 40:
Student Limiting Factors (Adapted f
- Page 41 and 42:
Student Data Analysis: Graph the re
- Page 43 and 44:
Teacher After activity: b. Assist g
- Page 45 and 46:
Student Designing Food Chains and F
- Page 47 and 48:
Student Shoreline Organisms Plants
- Page 49 and 50:
Teacher During activity: After acti
- Page 51 and 52:
Student Human Impact - Effects of A
- Page 53 and 54:
Student Effects of pH on the Germin
- Page 55 and 56:
Teacher During activity: from the f
- Page 57 and 58:
Student Evidence for the Theory of
- Page 59 and 60:
Student Deinonychus Fossil Evidence
- Page 61 and 62:
Student Figure 1 Table 1 Characteri
- Page 63 and 64:
Student Animal Table 2 Function of
- Page 65 and 66:
Student Conclusions: Explain in par
- Page 67 and 68:
Teacher d. Student misconceptions s
- Page 69 and 70:
Student Examining the Fossil Record
- Page 71 and 72:
Student period should be place towa
- Page 73 and 74:
Teacher Natural Selection (Adapted
- Page 75 and 76: Teacher Additional instructions/Han
- Page 77 and 78: Student Natural Selection (Adapted
- Page 79 and 80: Student Data Table 2 Beak Variation
- Page 81 and 82: Teacher After activity: What the te
- Page 83 and 84: Student Materials (per group): Inve
- Page 85 and 86: Student Taxonomic Key to the Major
- Page 87 and 88: Teacher 3. Is there more than one w
- Page 89 and 90: Teacher Strawberry Cucumber Banana
- Page 91 and 92: Teacher Strawberry Cucumber Banana
- Page 93 and 94: Student Classification of Fruits NG
- Page 95 and 96: Student Classifications of Fruit Gr
- Page 97 and 98: Teacher ii. What does it mean when
- Page 99 and 100: Teacher Organism Cards Name: Date P
- Page 101 and 102: Teacher The De-riving Force of Clad
- Page 103 and 104: Student 7. Select the next most sim
- Page 105 and 106: Teacher Plant Structure and Functio
- Page 107 and 108: Student Plant Structure and Functio
- Page 109 and 110: Student Answer the following questi
- Page 111 and 112: Student Part B: Roots Materials: Pl
- Page 113 and 114: Student Root Systems Using Figure 5
- Page 115 and 116: Student Tilia Stem (Woody growth):
- Page 117 and 118: Teacher Exploring Flower Structure
- Page 119 and 120: Student Exploring Flower Structure
- Page 121 and 122: Student 10. On which part of the fl
- Page 123 and 124: Teacher Investigating the Effect of
- Page 125: Student Investigating the Effect of
- Page 129 and 130: Student During activity: After acti
- Page 131 and 132: Student Procedures: 1. Write a hypo
- Page 133 and 134: Teacher Animal-Vertebrate Fish "Per
- Page 135 and 136: Student 10. To expose the internal
- Page 137 and 138: Teacher Circulation Lab (Adapted fr
- Page 139 and 140: Student Circulation Lab (Adapted fr
- Page 141 and 142: Teacher Take a Heart Hike (Adapted
- Page 143 and 144: Teacher Cardiovascular Model Biolog
- Page 145 and 146: Student Results and Conclusions: 1.
- Page 147 and 148: Teacher b. An asterisk (*) is place
- Page 149 and 150: Student Procedures: Before testing
- Page 151 and 152: Teacher Cell Model Project NGSSS: S
- Page 153 and 154: Teacher Extension: Gizmo: Cell Stru
- Page 155 and 156: Student You must be able to locate
- Page 157 and 158: Student Name: _____________________
- Page 159 and 160: Teacher After activity: 3. Fill a t
- Page 161 and 162: Student Diffusion and Osmosis NGSSS
- Page 163 and 164: Student Table 2 - Physical Changes
- Page 165 and 166: Teacher Investigating Inherited Tra
- Page 167 and 168: Teacher During activity: After acti
- Page 169 and 170: Student Investigating Inherited Tra
- Page 171 and 172: Student Observations/Data: Biology
- Page 173 and 174: Student Data Analysis: Sex of offsp
- Page 175 and 176: Teacher Differences in Similar Phen
- Page 177 and 178:
Student Differences in Similar Phen
- Page 179 and 180:
Student Measurement of Hand Length
- Page 181 and 182:
Student Graph Title: ______________
- Page 183 and 184:
Teacher Making Karyotypes (Adapted
- Page 185 and 186:
Teacher Extension: Gizmo: Human Kar
- Page 187 and 188:
Student 3. Identify the centromere
- Page 189 and 190:
Student 4. Use scissors to cut out
- Page 191 and 192:
Student 2. Comparing and Contrastin
- Page 193 and 194:
Teacher During activity: deoxyribos
- Page 195 and 196:
Student Building a DNA Model Projec
- Page 197 and 198:
Student Observations/Data: Construc
- Page 199 and 200:
Teacher DNA Extraction Lab NGSSS: S
- Page 201 and 202:
Student DNA Extraction Lab NGSSS: S
- Page 203 and 204:
Teacher Candy DNA Replication (Adap
- Page 205 and 206:
Student Candy DNA Replication (Adap
- Page 207 and 208:
Teacher Protein Synthesis: Transcri
- Page 209 and 210:
Teacher Extension: Gizmo: RNA and P
- Page 211 and 212:
Student Protein Synthesis: Transcri
- Page 213 and 214:
Student Protein Synthesis: Transcri
- Page 215 and 216:
Teacher Building Macromolecules NGS
- Page 217 and 218:
Student Building Macromolecules NGS
- Page 219 and 220:
Student Construct Glycine A. Draw a
- Page 221 and 222:
Student Construct Cytosine A. Cytos
- Page 223 and 224:
Student Try to determine some ways
- Page 225 and 226:
Teacher During activity: After acti
- Page 227 and 228:
Student 3. Using the forceps, dip a
- Page 229 and 230:
Teacher During activity: After acti
- Page 231 and 232:
Student Properties of Water NGSSS:
- Page 233 and 234:
Student Results: 1. From the data c
- Page 235 and 236:
Teacher differences 2. Did the data
- Page 237 and 238:
Student Observations/Data: Surface
- Page 239 and 240:
Teacher During activity: After acti
- Page 241 and 242:
Student Genetic Disorder: _________
- Page 243 and 244:
Modified Hands-on Activities
- Page 245 and 246:
Teacher 11. Have different students
- Page 247 and 248:
Teacher TURTLE GRASS TURTLE GRASS T
- Page 249 and 250:
Teacher DINOFLAGELLATES DINOFLAGELL
- Page 251 and 252:
Teacher SCALLOP SCALLOP TROPHIC LEV
- Page 253 and 254:
Teacher FISH LARVA FISH LARVA TROPH
- Page 255 and 256:
Teacher OCTOPUS OCTOPUS TROPHIC LEV
- Page 257 and 258:
Teacher SEA STAR SEA STAR TROPHIC L
- Page 259 and 260:
Teacher SEA URCHINS SEA URCHINS TRO
- Page 261 and 262:
Additional Hands-on Activities
- Page 263 and 264:
Teacher During activity: After acti
- Page 265 and 266:
Student Fun with Bubbles NGSSS: SC.
- Page 267 and 268:
Student Observations/Data: Diameter
- Page 269 and 270:
Teacher Stimuli Effects on Heart Ra
- Page 271 and 272:
Student Stimuli Effects on Heart Ra
- Page 273 and 274:
Student Procedures: 1. Select a sta
- Page 275 and 276:
Student Figure 4 Figure 5 Coughing:
- Page 277 and 278:
Student 4. The parasympathetic and
- Page 279 and 280:
Teacher During activity: After acti
- Page 281 and 282:
Student Stimuli Effects on Heart Ra
- Page 283 and 284:
Student a. Depending upon your size
- Page 285 and 286:
Student a. Tap the data point that
- Page 287 and 288:
Teacher Investigating Bacterial Gro
- Page 289 and 290:
Student Investigating Bacterial Gro
- Page 291 and 292:
Student 3. To inoculate your agar p
- Page 293 and 294:
Student Data Analysis/Results: Answ
- Page 295 and 296:
Teacher After activity: 2. Why do y
- Page 297 and 298:
Student Procedures: 1. The class is
- Page 299 and 300:
Teacher Identifying Organic Compoun
- Page 301 and 302:
Teacher During activity: After acti
- Page 303 and 304:
Student Identifying Organic Compoun
- Page 305 and 306:
Student 7. In each section, place a
- Page 307 and 308:
Student a microscope, patches of re