Metrobus Transit Study.pdf - City of St. John's
Metrobus Transit Study.pdf - City of St. John's
Metrobus Transit Study.pdf - City of St. John's

You also want an ePaper? Increase the reach of your titles
YUMPU automatically turns print PDFs into web optimized ePapers that Google loves.
<strong>St</strong>. John’s Transportation Commission (<strong>Metrobus</strong>) 2011<br />
Market Assessment and <strong>St</strong>rategic Directions <strong><strong>St</strong>udy</strong> – Part C: Assessment <strong>of</strong> Market Opportunities<br />
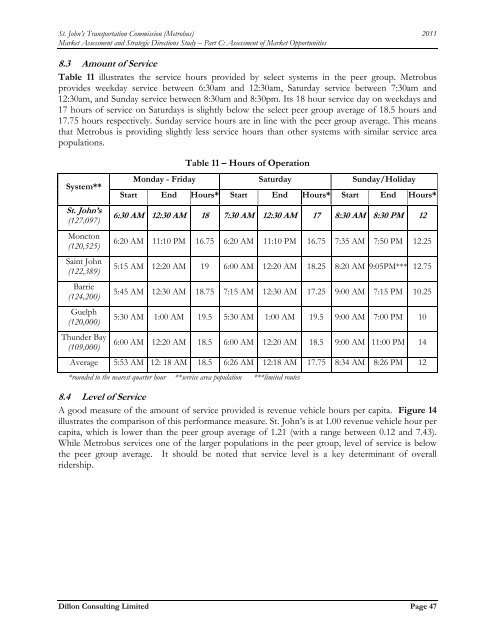
8.3 Amount <strong>of</strong> Service<br />
Table 11 illustrates the service hours provided by select systems in the peer group. <strong>Metrobus</strong><br />
provides weekday service between 6:30am and 12:30am, Saturday service between 7:30am and<br />
12:30am, and Sunday service between 8:30am and 8:30pm. Its 18 hour service day on weekdays and<br />
17 hours <strong>of</strong> service on Saturdays is slightly below the select peer group average <strong>of</strong> 18.5 hours and<br />
17.75 hours respectively. Sunday service hours are in line with the peer group average. This means<br />
that <strong>Metrobus</strong> is providing slightly less service hours than other systems with similar service area<br />
populations.<br />
System**<br />
<strong>St</strong>. John’s<br />
(127,097)<br />
Moncton<br />
(120,525)<br />
Saint John<br />
(122,389)<br />
Barrie<br />
(124,200)<br />
Guelph<br />
(120,000)<br />
Thunder Bay<br />
(109,000)<br />
Table 11 – Hours <strong>of</strong> Operation<br />
Monday - Friday Saturday Sunday/Holiday<br />
<strong>St</strong>art End Hours* <strong>St</strong>art End Hours* <strong>St</strong>art End Hours*<br />
6:30 AM 12:30 AM 18 7:30 AM 12:30 AM 17 8:30 AM 8:30 PM 12<br />
6:20 AM 11:10 PM 16.75 6:20 AM 11:10 PM 16.75 7:35 AM 7:50 PM 12.25<br />
5:15 AM 12:20 AM 19 6:00 AM 12:20 AM 18.25 8:20 AM 9:05PM*** 12.75<br />
5:45 AM 12:30 AM 18.75 7:15 AM 12:30 AM 17.25 9:00 AM 7:15 PM 10.25<br />
5:30 AM 1:00 AM 19.5 5:30 AM 1:00 AM 19.5 9:00 AM 7:00 PM 10<br />
6:00 AM 12:20 AM 18.5 6:00 AM 12:20 AM 18.5 9:00 AM 11:00 PM 14<br />
Average 5:53 AM 12: 18 AM 18.5 6:26 AM 12:18 AM 17.75 8:34 AM 8:26 PM 12<br />
*rounded to the nearest quarter hour **service area population ***limited routes<br />
8.4 Level <strong>of</strong> Service<br />
A good measure <strong>of</strong> the amount <strong>of</strong> service provided is revenue vehicle hours per capita. Figure 14<br />
illustrates the comparison <strong>of</strong> this performance measure. <strong>St</strong>. John’s is at 1.00 revenue vehicle hour per<br />
capita, which is lower than the peer group average <strong>of</strong> 1.21 (with a range between 0.12 and 7.43).<br />
While <strong>Metrobus</strong> services one <strong>of</strong> the larger populations in the peer group, level <strong>of</strong> service is below<br />
the peer group average. It should be noted that service level is a key determinant <strong>of</strong> overall<br />
ridership.<br />
Dillon Consulting Limited Page 47