Metrobus Transit Study.pdf - City of St. John's
Metrobus Transit Study.pdf - City of St. John's
Metrobus Transit Study.pdf - City of St. John's

You also want an ePaper? Increase the reach of your titles
YUMPU automatically turns print PDFs into web optimized ePapers that Google loves.
<strong>St</strong>. John’s Transportation Commission (<strong>Metrobus</strong>) 2011<br />
Market Assessment and <strong>St</strong>rategic Directions <strong><strong>St</strong>udy</strong> – Part C: Assessment <strong>of</strong> Market Opportunities<br />
9.1.3 Aging Population<br />
The elderly are an increasingly prominent segment <strong>of</strong> society and they will expect to be socially and<br />
economically active and independent. Many will work longer, by choice and by need. Most will be<br />
accustomed to driving and many will live in areas that are currently poorly served by transit. While<br />
active, aging seniors will require support and will bring higher expectations about the quality <strong>of</strong><br />
transportation services <strong>of</strong>fered (CUTA <strong>Transit</strong> Vision 2040).<br />
The largest population group in the Northeast Avalon Region has moved from 20-24 in 1986 to 40-<br />
44 in 2006. It is expected to move to the 50-54 group by 2016 and 60-64 by 2026. The ‘60 and over’<br />
population has seen a striking growth rate from 12 percent <strong>of</strong> the total population in 1986, to 17<br />
percent in 2006 with expected further growth to 23 percent by 2016 and 30 percent by 2026<br />
(Unpublished Newfoundland and Labrador Department <strong>of</strong> Municipal Affairs Report, 2009).<br />
With the <strong>City</strong>’s total population expected to remain stable for the foreseeable future, the rapid<br />
growth in the senior’s population has major implications for <strong>Metrobus</strong>, as this group is characterised<br />
by increasing mobility issues.<br />
The relationship between the incidence <strong>of</strong> disability and age can be demonstrated using data from<br />
the Participation and Activity Limitation Survey (PALS) data collected by <strong>St</strong>atistics Canada every<br />
five years. Data from the 2001 survey has been used in this report as complete data from the 2006<br />
survey is not available. It is noted that in the PALS surveys, a disability is defined as a condition that<br />
limits everyday activities because <strong>of</strong> a condition or health problem. It is recognized that this is a<br />
broad definition <strong>of</strong> disability and would include many individuals who do not require specialized<br />
transit for travel.<br />
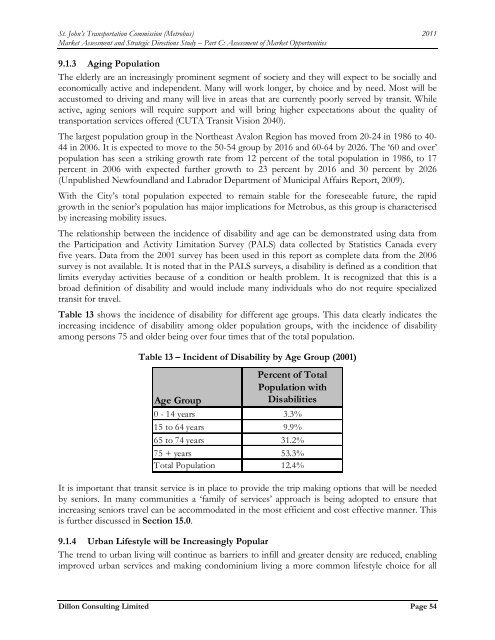
Table 13 shows the incidence <strong>of</strong> disability for different age groups. This data clearly indicates the<br />
increasing incidence <strong>of</strong> disability among older population groups, with the incidence <strong>of</strong> disability<br />
among persons 75 and older being over four times that <strong>of</strong> the total population.<br />
Table 13 – Incident <strong>of</strong> Disability by Age Group (2001)<br />
Percent <strong>of</strong> Total<br />
Population with<br />
Age Group<br />
Disabilities<br />
0 - 14 years 3.3%<br />
15 to 64 years 9.9%<br />
65 to 74 years 31.2%<br />
75 + years 53.3%<br />
Total Population 12.4%<br />
It is important that transit service is in place to provide the trip making options that will be needed<br />
by seniors. In many communities a ‘family <strong>of</strong> services’ approach is being adopted to ensure that<br />
increasing seniors travel can be accommodated in the most efficient and cost effective manner. This<br />
is further discussed in Section 15.0.<br />
9.1.4 Urban Lifestyle will be Increasingly Popular<br />
The trend to urban living will continue as barriers to infill and greater density are reduced, enabling<br />
improved urban services and making condominium living a more common lifestyle choice for all<br />
Dillon Consulting Limited Page 54