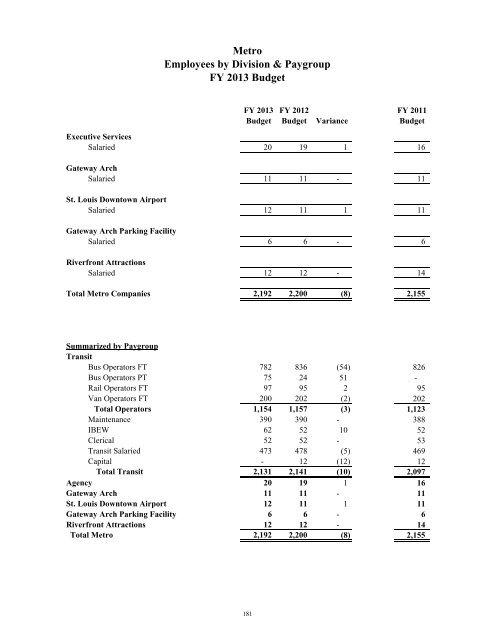
<strong>Metro</strong> Employees by Division & Paygroup <strong>FY</strong> <strong>2013</strong> <strong>Budget</strong> <strong>FY</strong> <strong>2013</strong> <strong>Budget</strong> <strong>FY</strong> 2012 <strong>Budget</strong> Variance <strong>FY</strong> 2011 <strong>Budget</strong> Executive Services Salaried 20 19 1 16 Gateway Arch Salaried 11 11 - 11 St. Louis Downtown Airport Salaried 12 11 1 11 Gateway Arch Parking Facility Salaried 6 6 - 6 Riverfront Attractions Salaried 12 12 - 14 Total <strong>Metro</strong> Companies 2,192 2,200 (8) 2,155 Summarized by Paygroup <strong>Transit</strong> Bus Operators FT Bus Operators PT Rail Operators FT Van Operators FT Total Operators Maintenance IBEW Clerical <strong>Transit</strong> Salaried <strong>Capital</strong> Total <strong>Transit</strong> Agency Gateway Arch St. Louis Downtown Airport Gateway Arch Parking Facility Riverfront Attractions Total <strong>Metro</strong> 782 75 97 200 1,154 390 62 52 473 - 2,131 20 11 12 6 12 2,192 836 24 95 202 1,157 390 52 52 478 12 2,141 19 11 11 6 12 2,200 (54) 51 2 (2) (3) - 10 - (5) (12) (10) 1 - 1 - - (8) 826 - 95 202 1,123 388 52 53 469 12 2,097 16 11 11 6 14 2,155 181
Performance Indicators: <strong>Metro</strong> <strong>Transit</strong> System <strong>FY</strong> <strong>2013</strong> <strong>FY</strong> 2012 <strong>FY</strong> 2011 <strong>Budget</strong> Projection <strong>Budget</strong> Actual Passenger boardings: System 45,583,043 44,720,249 44,267,424 <strong>Metro</strong>Bus 28,319,714 27,775,811 27,334,431 <strong>Metro</strong>Link 16,688,451 16,369,560 16,356,616 Call-A-Ride 574,878 574,878 576,377 Revenue miles: System 26,716,925 26,758,559 27,145,673 <strong>Metro</strong>Bus 18,681,217 18,805,371 19,235,017 <strong>Metro</strong>Link 3,241,396 3,243,419 3,251,749 Call-A-Ride 4,794,312 4,709,769 4,658,907 Revenue hours: System 1,815,413 1,815,991 1,831,415 <strong>Metro</strong>Bus 1,365,076 1,371,985 1,399,050 <strong>Metro</strong>Link 134,709 134,822 135,174 Call-A-Ride 315,628 309,184 297,191 Passenger revenue System $ 50,457,530 $ 48,517,752 $ 48,522,966 (excluding TMA <strong>and</strong> <strong>Metro</strong>Bus 31,151,684 29,941,283 29,794,530 contractual) <strong>Metro</strong>Link 18,357,297 17,645,772 17,828,712 Call-A-Ride 948,549 930,697 899,724 TMA (regional van services) & contractual Medicaid services $ 5,323,500 $ 5,376,150 5,531,000 <strong>Operating</strong> expense by mode: System $ 249,717,198 $ 238,344,386 $ 243,117,784 <strong>Metro</strong>Bus 158,216,039 150,971,042 156,521,080 <strong>Metro</strong>Link 68,266,285 64,110,458 64,495,924 Call-A-Ride 23,234,874 21,756,079 22,100,781 Passenger boardings per System 1.7 1.7 1.6 revenue mile: <strong>Metro</strong>Bus 1.5 1.5 1.4 <strong>Metro</strong>Link 5.1 5.0 5.0 Call-A-Ride 0.1 0.1 0.1 <strong>Operating</strong> expense: Per revenue mile: System $ 9.35 $ 8.91 $ 8.96 <strong>Metro</strong>Bus 8.47 8.03 8.14 <strong>Metro</strong>Link 21.06 19.77 19.83 Call-A-Ride 4.85 4.62 4.74 Per revenue hour: System $ 137.55 $ 131.25 $ 132.75 <strong>Metro</strong>Bus 115.90 110.04 111.88 <strong>Metro</strong>Link 506.77 475.52 477.13 Call-A-Ride 73.61 70.37 74.37 Per passenger boarding System $ 5.48 $ 5.33 $ 5.49 <strong>Metro</strong>Bus 5.59 5.44 5.73 <strong>Metro</strong>Link 4.09 3.92 3.94 Call-A-Ride 40.42 37.84 38.34 Farebox recovery: System 20.2% 20.4% 20.0% <strong>Metro</strong>Bus 19.7% 19.8% 19.0% <strong>Metro</strong>Link 26.9% 27.5% 27.6% Call-A-Ride 4.1% 4.3% 4.1% Subsidy per passenger boarding: System $ 4.16 $ 4.03 $ 4.18 <strong>Metro</strong>Bus 4.40 4.26 4.54 <strong>Metro</strong>Link 2.90 2.74 2.76 Call-A-Ride 29.42 26.78 27.10 $ 42,992,656 26,215,139 16,209,098 568,419 25,973,037 18,198,749 3,147,572 4,626,716 1,760,053 1,328,276 131,403 300,373 46,115,422 27,975,613 17,251,412 888,397 $ $ 5,134,269 $ 220,559,676 139,588,571 62,152,456 18,818,649 $ $ $ $ 1.7 1.4 5.1 0.1 8.49 7.67 19.75 4.07 125.31 105.09 472.99 62.65 5.13 5.32 3.83 33.11 20.9% 20.0% 27.8% 4.7% 3.84 4.16 2.67 22.41 182
- Page 1 and 2:
Metro Operating and Capital Budget
- Page 3 and 4:
TABLE OF CONTENTS Budget Process Op
- Page 5 and 6:
TABLE OF CONTENTS Supplementary Met
- Page 7 and 8:
Board of Commissioners Illinois Mic
- Page 9 and 10:
March 23, 2012 Message from the Pre
- Page 11 and 12:
We are proud that Metro Transit is
- Page 13 and 14:
Louis, as well as audit positions w
- Page 15 and 16:
Bi-State Development Agency (d.b.a
- Page 17 and 18:
Bi-State Development Agency Profile
- Page 19 and 20:
Community Profile Population and Cu
- Page 21 and 22:
The America’s Center Convention C
- Page 23 and 24:
Strategic Plan Overview Purpose of
- Page 25 and 26:
Metro’s strategic alignment to Th
- Page 27 and 28:
Linking Strategic Plan to Budgets -
- Page 29 and 30:
Financial Policies, Fund Balances,
- Page 31 and 32:
Department of Transportation. All i
- Page 33 and 34:
Metro Operating and Capital Budget
- Page 35 and 36:
Additional expenditure control tool
- Page 37 and 38:
Fair Value of Financial Instruments
- Page 39 and 40:
enefits under the plan and to const
- Page 41 and 42:
Union Plans Salaried Plan 788 O&M 7
- Page 43 and 44:
Debt Policies Legal Debt Limits Cur
- Page 45 and 46:
Grants and Assistance All capital g
- Page 47 and 48:
Financial Reserve Policies Restrict
- Page 49 and 50:
Financing Instruments, Obligations
- Page 51 and 52:
through a surety policy, the paymen
- Page 53 and 54:
Long-Term Debt Debt and capital lea
- Page 55 and 56:
Fiscal Interest Year Principal Expe
- Page 57 and 58:
Series 2009 In October 2009, the Ex
- Page 59 and 60:
Fiscal Interest Year Principal Expe
- Page 61 and 62:
The Budget Process and Stakeholder
- Page 63 and 64:
Capital Budget External Review and
- Page 65 and 66:
FY 2013 Operating Budget Calendar S
- Page 67 and 68:
Metro Transit System MetroBus Overv
- Page 69 and 70:
Metro Transit System Call-A-Ride Ov
- Page 71 and 72:
Metro Transit System Detail of Gran
- Page 73 and 74:
Passenger Revenue (in millions) 200
- Page 75 and 76:
Parts & supplies expense is expecte
- Page 77 and 78:
JARC grants include anticipated rev
- Page 79 and 80:
Transit Operations . Operational ov
- Page 81 and 82:
Objective: Improve service quality
- Page 83 and 84:
Goal: To be an effective and effici
- Page 85 and 86:
$ Change % Change FY 2013 FY 2012 1
- Page 87 and 88:
Engineering & New Systems Developme
- Page 89 and 90:
Engineering & New Systems Developme
- Page 91 and 92:
Human Resources - Goals and Objecti
- Page 93 and 94:
Human Resources - Operating Expense
- Page 95 and 96:
Procurement, Inventory Management &
- Page 97 and 98:
Procurement, Inventory Management &
- Page 99 and 100:
Goals and Objectives Action Plan: S
- Page 101 and 102:
Strategy Action Steps Performance M
- Page 103 and 104:
Finance: Performance Indicators FY
- Page 105 and 106:
Information Technology Organization
- Page 107 and 108:
Communications & Community Relation
- Page 109 and 110:
Communications & Community Relation
- Page 111 and 112:
Strategy Action Steps Performance M
- Page 113 and 114:
Real Estate and Economic Developmen
- Page 115 and 116:
Metro Transit System Transit Improv
- Page 117 and 118:
Other Federal assistance for non-ca
- Page 119 and 120:
Metro Transit System Transit Improv
- Page 121 and 122:
Disabilities Act (ADA). Funds will
- Page 123 and 124:
Metro Transit System Capital Expend
- Page 125 and 126:
of the Grand Avenue Bridge Elevator
- Page 127 and 128:
Metro Transit System Impact of Capi
- Page 129 and 130:
Significant Capital Improvement Pro
- Page 131 and 132:
Metro System Transportation Improve
- Page 133 and 134:
FY 2013 Capital Programs and Projec
- Page 135 and 136: FY 2013 - FY 2015 Capital Programs
- Page 137 and 138: Metro System Transportation Improve
- Page 139 and 140: Business Enterprises The Business E
- Page 141 and 142: Gateway Arch Operating Budget Summa
- Page 143 and 144: Expense Wages and benefits excludin
- Page 145 and 146: Goals and Objectives Action Plan Th
- Page 147 and 148: Business Enterprises Gateway Arch F
- Page 149 and 150: Gateway Arch Parking Facility Opera
- Page 151 and 152: Other revenue includes revenue from
- Page 153 and 154: Goals and Objectives Action Plan Th
- Page 155 and 156: Business Enterprises Gateway Arch P
- Page 157 and 158: Riverfront Attractions Operating Bu
- Page 159 and 160: Beverage revenue for FY 2013 is gen
- Page 161 and 162: Gateway Arch Riverfront Attractions
- Page 163 and 164: Business Enterprises St. Louis Down
- Page 165 and 166: Business Enterprises St. Louis Down
- Page 167 and 168: Other expense includes the followin
- Page 169 and 170: Objective: Deliver quality capital
- Page 171 and 172: Executive Services Operating Budget
- Page 173 and 174: Expense Compensation and benefits f
- Page 175 and 176: Goals and Objectives Action Plan Th
- Page 177 and 178: Objective: Implement revenue enhanc
- Page 179 and 180: FY 2013 FY 2012 FY 2011 Target Proj
- Page 181 and 182: Executive Services - Operating Expe
- Page 183 and 184: Business Enterprises Operating Budg
- Page 185: Metro Employees by Division & Paygr
- Page 189 and 190: Glossary CMAQ grant - A federal Con
- Page 191 and 192: Glossary MoDOT - Missouri Departmen
- Page 193 and 194: Glossary TRIP - Transit in the Park
- Page 195 and 196: Glossary of Acronyms EWGCOG FASB FT
- Page 197 and 198: Index of Tables, Lists, and Charts
- Page 199 and 200: Index of Tables, Lists, and Charts
- Page 201 and 202: Index of Tables, Lists, and Charts