FY 2013 Operating and Capital Budget - Metro Transit
FY 2013 Operating and Capital Budget - Metro Transit
FY 2013 Operating and Capital Budget - Metro Transit

Create successful ePaper yourself
Turn your PDF publications into a flip-book with our unique Google optimized e-Paper software.
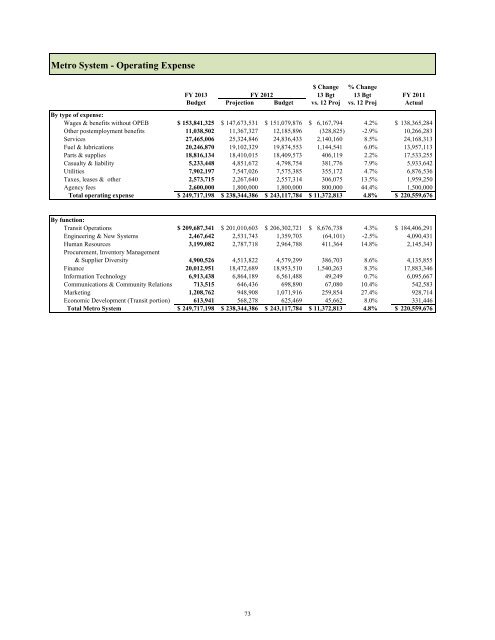
<strong>Metro</strong> System - <strong>Operating</strong> Expense<br />
$ Change % Change<br />
<strong>FY</strong> <strong>2013</strong> <strong>FY</strong> 2012<br />
13 Bgt 13 Bgt<br />
<strong>Budget</strong> Projection <strong>Budget</strong> vs. 12 Proj vs. 12 Proj<br />
By type of expense:<br />
Wages & benefits without OPEB $ 153,841,325 $ 147,673,531 $ 151,079,876 $ 6,167,794 4.2%<br />
Other postemployment benefits 11,038,502 11,367,327 12,185,896 (328,825) -2.9%<br />
Services 27,465,006 25,324,846 24,836,433 2,140,160 8.5%<br />
Fuel & lubrications 20,246,870 19,102,329 19,874,553 1,144,541 6.0%<br />
Parts & supplies 18,816,134 18,410,015 18,409,573 406,119 2.2%<br />
Casualty & liability 5,233,448 4,851,672 4,798,754 381,776 7.9%<br />
Utilities 7,902,197 7,547,026 7,575,385 355,172 4.7%<br />
Taxes, leases & other 2,573,715 2,267,640 2,557,314 306,075 13.5%<br />
Agency fees 2,600,000 1,800,000 1,800,000 800,000 44.4%<br />
Total operating expense $ 249,717,198 $ 238,344,386 $ 243,117,784 $ 11,372,813 4.8%<br />
<strong>FY</strong> 2011<br />
Actual<br />
$ 138,365,284<br />
10,266,283<br />
24,168,313<br />
13,957,113<br />
17,533,255<br />
5,933,642<br />
6,876,536<br />
1,959,250<br />
1,500,000<br />
$ 220,559,676<br />
By function:<br />
<strong>Transit</strong> Operations $ 209,687,341 $ 201,010,603 $ 206,302,721 $ 8,676,738 4.3%<br />
Engineering & New Systems 2,467,642 2,531,743 1,359,703 (64,101) -2.5%<br />
Human Resources 3,199,082 2,787,718 2,964,788 411,364 14.8%<br />
Procurement, Inventory Management<br />
& Supplier Diversity 4,900,526 4,513,822 4,579,299 386,703 8.6%<br />
Finance 20,012,951 18,472,689 18,953,510 1,540,263 8.3%<br />
Information Technology 6,913,438 6,864,189 6,561,488 49,249 0.7%<br />
Communications & Community Relations 713,515 646,436 698,890 67,080 10.4%<br />
Marketing 1,208,762 948,908 1,071,916 259,854 27.4%<br />
Economic Development (<strong>Transit</strong> portion) 613,941 568,278 625,469 45,662 8.0%<br />
Total <strong>Metro</strong> System $ 249,717,198 $ 238,344,386 $ 243,117,784 $ 11,372,813 4.8%<br />
$ 184,406,291<br />
4,090,431<br />
2,145,343<br />
4,135,855<br />
17,883,346<br />
6,095,667<br />
542,583<br />
928,714<br />
331,446<br />
$ 220,559,676<br />
73