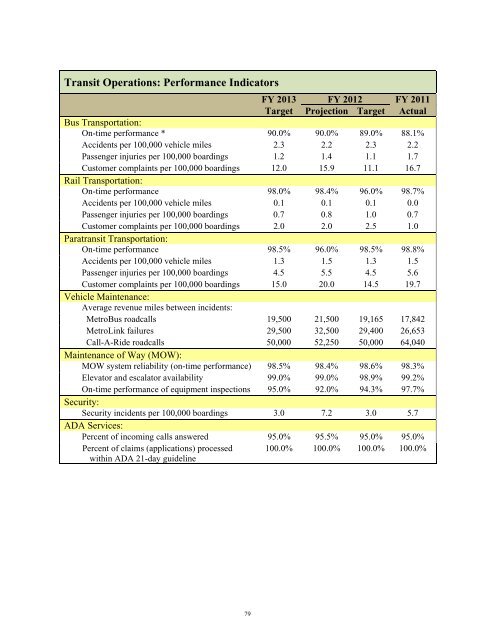
<strong>Transit</strong> Operations: Performance Indicators <strong>FY</strong> <strong>2013</strong> <strong>FY</strong> 2012 <strong>FY</strong> 2011 Target Projection Target Actual Bus Transportation: On-time performance * 90.0% 90.0% 89.0% 88.1% Accidents per 100,000 vehicle miles 2.3 2.2 2.3 2.2 Passenger injuries per 100,000 boardings 1.2 1.4 1.1 1.7 Customer complaints per 100,000 boardings 12.0 15.9 11.1 16.7 Rail Transportation: On-time performance 98.0% 98.4% 96.0% 98.7% Accidents per 100,000 vehicle miles 0.1 0.1 0.1 0.0 Passenger injuries per 100,000 boardings 0.7 0.8 1.0 0.7 Customer complaints per 100,000 boardings 2.0 2.0 2.5 1.0 Paratransit Transportation: On-time performance 98.5% 96.0% 98.5% 98.8% Accidents per 100,000 vehicle miles 1.3 1.5 1.3 1.5 Passenger injuries per 100,000 boardings 4.5 5.5 4.5 5.6 Customer complaints per 100,000 boardings 15.0 20.0 14.5 19.7 Vehicle Maintenance: Average revenue miles between incidents: <strong>Metro</strong>Bus roadcalls 19,500 21,500 19,165 17,842 <strong>Metro</strong>Link failures 29,500 32,500 29,400 26,653 Call-A-Ride roadcalls 50,000 52,250 50,000 64,040 Maintenance of Way (MOW): MOW system reliability (on-time performance) 98.5% 98.4% 98.6% 98.3% Elevator <strong>and</strong> escalator availability 99.0% 99.0% 98.9% 99.2% On-time performance of equipment inspections 95.0% 92.0% 94.3% 97.7% Security: Security incidents per 100,000 boardings 3.0 7.2 3.0 5.7 ADA Services: Percent of incoming calls answered 95.0% 95.5% 95.0% 95.0% Percent of claims (applications) processed within ADA 21-day guideline 100.0% 100.0% 100.0% 100.0% 79
$ Change % Change <strong>FY</strong> <strong>2013</strong> <strong>FY</strong> 2012 13 Bgt 13 Bgt <strong>FY</strong> 2011 <strong>Budget</strong> Projection <strong>Budget</strong> vs. 12 Proj vs. 12 Proj Actual <strong>Transit</strong> Wages & benefits without OPEB $ 135,771,342 $ 130,451,464 $ 133,254,963 $ 5,319,878 4.1% $ 122,114,587 Operations Other postemployment benefits 9,590,124 9,827,218 10,505,410 (237,094) -2.4% 9,637,272 Services 18,694,118 17,088,740 18,106,891 1,605,378 9.4% 15,591,309 Fuel & lubrications 20,246,870 19,101,829 19,873,553 1,145,041 6.0% 13,957,113 Parts & supplies 16,932,194 16,782,775 16,684,135 149,418 0.9% 16,024,096 Utilities 7,369,231 7,018,126 7,014,786 351,105 5.0% 6,436,618 Taxes, leases & other 1,083,462 740,450 862,985 343,012 46.3% 645,297 <strong>Operating</strong> expense $ 209,687,341 $ 201,010,603 $ 206,302,721 $ 8,676,738 4.3% $ 184,406,291 Bus Wages & benefits without OPEB 68,114,409 65,913,539 68,519,148 2,200,870 3.3% 61,837,589 Transportation Other postemployment benefits 5,115,717 5,273,464 5,642,035 (157,747) -3.0% 5,099,581 Services 213,500 169,949 200,550 43,551 25.6% 131,054 Parts & supplies 271,305 187,076 225,945 84,229 45.0% 147,472 Utilities 31,080 29,945 31,848 1,135 3.8% 23,216 Taxes, leases & other 114,119 76,718 122,254 37,401 48.8% 51,958 <strong>Operating</strong> expense 73,860,130 71,650,690 74,741,780 2,209,440 3.1% 67,290,871 Rail Wages & benefits without OPEB 10,476,076 10,013,086 10,144,407 462,990 4.6% 9,523,560 Transportation Other postemployment benefits 825,642 825,659 892,017 (16) 0.0% 831,124 Services 4,714 5,367 6,514 (653) -12.2% 5,551 Parts & supplies 20,750 17,048 18,300 3,702 21.7% 8,825 Utilities 23,244 18,470 23,244 4,774 25.8% 15,990 Taxes, leases & other 108,700 62,230 78,450 46,470 74.7% 55,543 <strong>Operating</strong> expense 11,459,126 10,941,859 11,162,931 517,267 4.7% 10,440,593 Paratransit Wages & benefits without OPEB 12,639,044 12,240,057 12,358,061 398,987 3.3% 10,835,729 Transportation Other postemployment benefits 215,419 230,245 255,250 (14,826) -6.4% 227,099 Services 240,267 188,867 240,517 51,400 27.2% 147,543 Parts & supplies 37,986 29,659 47,590 8,327 28.1% 15,421 Utilities 21,240 19,069 21,240 2,171 11.4% 16,764 Taxes, leases & other 38,800 39,688 38,800 (888) -2.2% 22,898 <strong>Operating</strong> expense 13,192,755 12,747,585 12,961,458 445,170 3.5% 11,265,452 Vehicle Wages & benefits without OPEB 25,473,849 24,116,115 115 24,265,475265 475 1,357,734 734 56% 5.6% 22,462,825 Maintenance Other postemployment benefits 2,043,339 2,026,929 2,085,100 16,411 0.8% 2,041,254 Services 2,047,953 2,016,827 1,951,043 31,126 1.5% 1,910,582 Fuel & lubrications 20,245,510 19,101,649 19,873,193 1,143,861 6.0% 13,954,494 Parts & supplies 13,566,961 13,761,063 13,323,172 (194,101) -1.4% 12,707,287 Utilities 16,200 15,224 15,300 976 6.4% 14,666 Taxes, leases & other 341,502 226,166 156,088 115,337 51.0% 173,475 <strong>Operating</strong> expense 63,735,316 61,263,973 61,669,370 2,471,343 4.0% 53,264,584 Facility Wages & benefits without OPEB 2,312,208 2,344,469 2,227,515 (32,260) -1.4% 2,139,509 Maintenance Other postemployment benefits 186,666 191,382 205,238 (4,716) -2.5% 187,548 Services 2,041,288 1,867,860 1,925,306 173,428 9.3% 1,755,472 Parts & supplies 928,158 767,777 892,914 160,381 20.9% 701,912 Utilities 2,823,976 2,605,981 2,569,163 217,995 8.4% 2,245,701 Taxes, leases & other 40,848 31,420 39,720 9,428 30.0% 28,399 <strong>Operating</strong> expense 8,334,504 7,809,068 7,860,217 525,435 6.7% 7,061,159 Maintenance Wages & benefits without OPEB 9,892,587 9,588,333 9,243,851 304,254 3.2% 9,506,584 of Way Other postemployment benefits 703,318 821,536 921,565 (118,218) -14.4% 765,305 Services 6,618,076 5,416,178 6,399,186 1,201,898 22.2% 4,701,992 Parts & supplies 1,750,525 1,689,092 1,691,595 61,433 3.6% 1,792,069 Utilities 4,400,304 4,271,899 4,303,017 128,405 3.0% 4,052,656 Taxes, leases & other 121,170 73,459 121,170 47,711 64.9% 131,095 <strong>Operating</strong> expense 23,485,980 21,860,496 22,680,384 1,625,484 7.4% 20,949,700 80
- Page 1 and 2:
Metro Operating and Capital Budget
- Page 3 and 4:
TABLE OF CONTENTS Budget Process Op
- Page 5 and 6:
TABLE OF CONTENTS Supplementary Met
- Page 7 and 8:
Board of Commissioners Illinois Mic
- Page 9 and 10:
March 23, 2012 Message from the Pre
- Page 11 and 12:
We are proud that Metro Transit is
- Page 13 and 14:
Louis, as well as audit positions w
- Page 15 and 16:
Bi-State Development Agency (d.b.a
- Page 17 and 18:
Bi-State Development Agency Profile
- Page 19 and 20:
Community Profile Population and Cu
- Page 21 and 22:
The America’s Center Convention C
- Page 23 and 24:
Strategic Plan Overview Purpose of
- Page 25 and 26:
Metro’s strategic alignment to Th
- Page 27 and 28:
Linking Strategic Plan to Budgets -
- Page 29 and 30:
Financial Policies, Fund Balances,
- Page 31 and 32:
Department of Transportation. All i
- Page 33 and 34: Metro Operating and Capital Budget
- Page 35 and 36: Additional expenditure control tool
- Page 37 and 38: Fair Value of Financial Instruments
- Page 39 and 40: enefits under the plan and to const
- Page 41 and 42: Union Plans Salaried Plan 788 O&M 7
- Page 43 and 44: Debt Policies Legal Debt Limits Cur
- Page 45 and 46: Grants and Assistance All capital g
- Page 47 and 48: Financial Reserve Policies Restrict
- Page 49 and 50: Financing Instruments, Obligations
- Page 51 and 52: through a surety policy, the paymen
- Page 53 and 54: Long-Term Debt Debt and capital lea
- Page 55 and 56: Fiscal Interest Year Principal Expe
- Page 57 and 58: Series 2009 In October 2009, the Ex
- Page 59 and 60: Fiscal Interest Year Principal Expe
- Page 61 and 62: The Budget Process and Stakeholder
- Page 63 and 64: Capital Budget External Review and
- Page 65 and 66: FY 2013 Operating Budget Calendar S
- Page 67 and 68: Metro Transit System MetroBus Overv
- Page 69 and 70: Metro Transit System Call-A-Ride Ov
- Page 71 and 72: Metro Transit System Detail of Gran
- Page 73 and 74: Passenger Revenue (in millions) 200
- Page 75 and 76: Parts & supplies expense is expecte
- Page 77 and 78: JARC grants include anticipated rev
- Page 79 and 80: Transit Operations . Operational ov
- Page 81 and 82: Objective: Improve service quality
- Page 83: Goal: To be an effective and effici
- Page 87 and 88: Engineering & New Systems Developme
- Page 89 and 90: Engineering & New Systems Developme
- Page 91 and 92: Human Resources - Goals and Objecti
- Page 93 and 94: Human Resources - Operating Expense
- Page 95 and 96: Procurement, Inventory Management &
- Page 97 and 98: Procurement, Inventory Management &
- Page 99 and 100: Goals and Objectives Action Plan: S
- Page 101 and 102: Strategy Action Steps Performance M
- Page 103 and 104: Finance: Performance Indicators FY
- Page 105 and 106: Information Technology Organization
- Page 107 and 108: Communications & Community Relation
- Page 109 and 110: Communications & Community Relation
- Page 111 and 112: Strategy Action Steps Performance M
- Page 113 and 114: Real Estate and Economic Developmen
- Page 115 and 116: Metro Transit System Transit Improv
- Page 117 and 118: Other Federal assistance for non-ca
- Page 119 and 120: Metro Transit System Transit Improv
- Page 121 and 122: Disabilities Act (ADA). Funds will
- Page 123 and 124: Metro Transit System Capital Expend
- Page 125 and 126: of the Grand Avenue Bridge Elevator
- Page 127 and 128: Metro Transit System Impact of Capi
- Page 129 and 130: Significant Capital Improvement Pro
- Page 131 and 132: Metro System Transportation Improve
- Page 133 and 134: FY 2013 Capital Programs and Projec
- Page 135 and 136:
FY 2013 - FY 2015 Capital Programs
- Page 137 and 138:
Metro System Transportation Improve
- Page 139 and 140:
Business Enterprises The Business E
- Page 141 and 142:
Gateway Arch Operating Budget Summa
- Page 143 and 144:
Expense Wages and benefits excludin
- Page 145 and 146:
Goals and Objectives Action Plan Th
- Page 147 and 148:
Business Enterprises Gateway Arch F
- Page 149 and 150:
Gateway Arch Parking Facility Opera
- Page 151 and 152:
Other revenue includes revenue from
- Page 153 and 154:
Goals and Objectives Action Plan Th
- Page 155 and 156:
Business Enterprises Gateway Arch P
- Page 157 and 158:
Riverfront Attractions Operating Bu
- Page 159 and 160:
Beverage revenue for FY 2013 is gen
- Page 161 and 162:
Gateway Arch Riverfront Attractions
- Page 163 and 164:
Business Enterprises St. Louis Down
- Page 165 and 166:
Business Enterprises St. Louis Down
- Page 167 and 168:
Other expense includes the followin
- Page 169 and 170:
Objective: Deliver quality capital
- Page 171 and 172:
Executive Services Operating Budget
- Page 173 and 174:
Expense Compensation and benefits f
- Page 175 and 176:
Goals and Objectives Action Plan Th
- Page 177 and 178:
Objective: Implement revenue enhanc
- Page 179 and 180:
FY 2013 FY 2012 FY 2011 Target Proj
- Page 181 and 182:
Executive Services - Operating Expe
- Page 183 and 184:
Business Enterprises Operating Budg
- Page 185 and 186:
Metro Employees by Division & Paygr
- Page 187 and 188:
Performance Indicators: Metro Trans
- Page 189 and 190:
Glossary CMAQ grant - A federal Con
- Page 191 and 192:
Glossary MoDOT - Missouri Departmen
- Page 193 and 194:
Glossary TRIP - Transit in the Park
- Page 195 and 196:
Glossary of Acronyms EWGCOG FASB FT
- Page 197 and 198:
Index of Tables, Lists, and Charts
- Page 199 and 200:
Index of Tables, Lists, and Charts
- Page 201 and 202:
Index of Tables, Lists, and Charts