FY 2013 Operating and Capital Budget - Metro Transit
FY 2013 Operating and Capital Budget - Metro Transit
FY 2013 Operating and Capital Budget - Metro Transit

You also want an ePaper? Increase the reach of your titles
YUMPU automatically turns print PDFs into web optimized ePapers that Google loves.
Linking Strategic Plan to <strong>Budget</strong>s - Both the short <strong>and</strong> long term strategic plans are the primary<br />
drivers for annual operating <strong>and</strong> capital budgets. The annual operating <strong>and</strong> capital budgets reflect<br />
updated short-term goals <strong>and</strong> objectives identified in the strategic plan by quantifying expected<br />
revenues <strong>and</strong> expense needed to meet the short-term goals. The Company’s organizational units<br />
play a vital role in achieving these goals. The strategy, steps <strong>and</strong> performance measures of the<br />
organizational units are documented under the functions <strong>and</strong> activities of the organizational units<br />
section.<br />
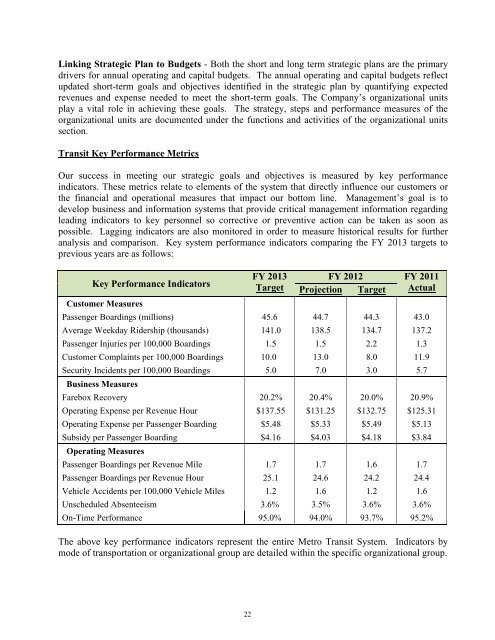
<strong>Transit</strong> Key Performance Metrics<br />
Our success in meeting our strategic goals <strong>and</strong> objectives is measured by key performance<br />
indicators. These metrics relate to elements of the system that directly influence our customers or<br />
the financial <strong>and</strong> operational measures that impact our bottom line. Management’s goal is to<br />
develop business <strong>and</strong> information systems that provide critical management information regarding<br />
leading indicators to key personnel so corrective or preventive action can be taken as soon as<br />
possible. Lagging indicators are also monitored in order to measure historical results for further<br />
analysis <strong>and</strong> comparison. Key system performance indicators comparing the <strong>FY</strong> <strong>2013</strong> targets to<br />
previous years are as follows:<br />
Key Performance Indicators<br />
<strong>FY</strong> <strong>2013</strong> <strong>FY</strong> 2012 <strong>FY</strong> 2011<br />
Target Projection Target Actual<br />
Customer Measures<br />
Passenger Boardings (millions) 45.6 44.7 44.3 43.0<br />
Average Weekday Ridership (thous<strong>and</strong>s) 141.0 138.5 134.7 137.2<br />
Passenger Injuries per 100,000 Boardings 1.5 1.5 2.2 1.3<br />
Customer Complaints per 100,000 Boardings 10.0 13.0 8.0 11.9<br />
Security Incidents per 100,000 Boardings 5.0 7.0 3.0 5.7<br />
Business Measures<br />
Farebox Recovery 20.2% 20.4% 20.0% 20.9%<br />
<strong>Operating</strong> Expense per Revenue Hour $137.55 $131.25 $132.75 $125.31<br />
<strong>Operating</strong> Expense per Passenger Boarding $5.48 $5.33 $5.49 $5.13<br />
Subsidy per Passenger Boarding $4.16 $4.03 $4.18 $3.84<br />
<strong>Operating</strong> Measures<br />
Passenger Boardings per Revenue Mile 1.7 1.7 1.6 1.7<br />
Passenger Boardings per Revenue Hour 25.1 24.6 24.2 24.4<br />
Vehicle Accidents per 100,000 Vehicle Miles 1.2 1.6 1.2 1.6<br />
Unscheduled Absenteeism 3.6% 3.5% 3.6% 3.6%<br />
On-Time Performance 95.0% 94.0% 93.7% 95.2%<br />
The above key performance indicators represent the entire <strong>Metro</strong> <strong>Transit</strong> System. Indicators by<br />
mode of transportation or organizational group are detailed within the specific organizational group.<br />
22