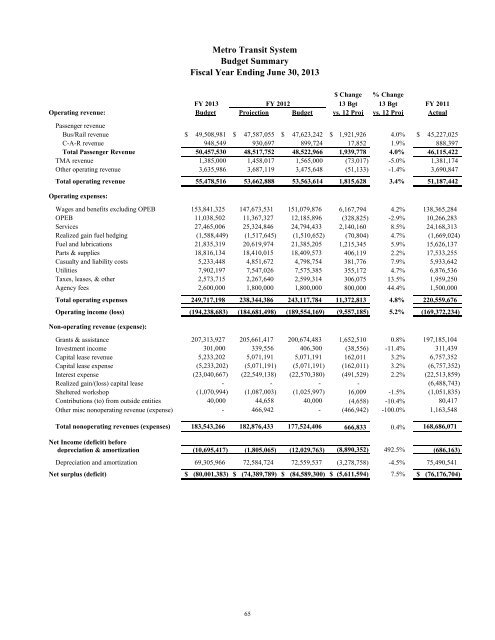
<strong>Metro</strong> <strong>Transit</strong> System <strong>Budget</strong> Summary Fiscal Year Ending June 30, <strong>2013</strong> $ Change 13 Bgt vs. 12 Proj % Change 13 Bgt vs. 12 Proj <strong>FY</strong> <strong>2013</strong> <strong>FY</strong> 2012 <strong>FY</strong> 2011 <strong>Operating</strong> revenue: <strong>Budget</strong> Projection <strong>Budget</strong> Actual Passenger revenue Bus/Rail revenue $ 49,508,981 $ 47,587,055 $ 47,623,242 $ 1,921,926 4.0% $ 45,227,025 C-A-R revenue 948,549 930,697 899,724 17,852 1.9% 888,397 Total Passenger Revenue 50,457,530 48,517,752 48,522,966 1,939,778 4.0% 46,115,422 TMA revenue 1,385,000 1,458,017 1,565,000 (73,017) -5.0% 1,381,174 Other operating revenue 3,635,986 3,687,119 3,475,648 (51,133) -1.4% 3,690,847 Total operating revenue 55,478,516 53,662,888 53,563,614 1,815,628 3.4% 51,187,442 <strong>Operating</strong> expenses: Wages <strong>and</strong> benefits excluding OPEB OPEB Services Realized gain fuel hedging Fuel <strong>and</strong> lubrications Parts & supplies Casualty <strong>and</strong> liability costs Utilities Taxes, leases, & other Agency fees 153,841,325 11,038,502 27,465,006 (1,588,449) 21,835,319 18,816,134 5,233,448 7,902,197 2,573,715 2,600,000 147,673,531 11,367,327 25,324,846 (1,517,645) 20,619,974 18,410,015 4,851,672 7,547,026 2,267,640 1,800,000 151,079,876 12,185,896 24,794,433 (1,510,652) 21,385,205 18,409,573 4,798,754 7,575,385 2,599,314 1,800,000 6,167,794 (328,825) 2,140,160 (70,804) 1,215,345 406,119 381,776 355,172 306,075 800,000 4.2% -2.9% 8.5% 4.7% 5.9% 2.2% 7.9% 4.7% 13.5% 44.4% 138,365,284 10,266,283 24,168,313 (1,669,024) 15,626,137 17,533,255 5,933,642 6,876,536 1,959,250 1,500,000 Total operating expenses 249,717,198 238,344,386 243,117,784 11,372,813 4.8% 220,559,676 <strong>Operating</strong> income (loss) (194,238,683) (184,681,498) (189,554,169) (9,557,185) 5.2% (169,372,234) Non-operating revenue (expense): Grants & assistance Investment income <strong>Capital</strong> lease revenue <strong>Capital</strong> lease expense Interest expense Realized gain/(loss) capital lease Sheltered workshop Contributions (to) from outside entities Other misc nonoperating revenue (expense) 207,313,927 , 301,000 5,233,202 (5,233,202) (23,040,667) - (1,070,994) 40,000 - 205,661,417 , 339,556 5,071,191 (5,071,191) (22,549,138) - (1,087,003) 44,658 466,942 200,674,483 , 406,300 5,071,191 (5,071,191) (22,570,380) - (1,025,997) 40,000 - 1,652,510 , (38,556) 162,011 (162,011) (491,529) - 16,009 (4,658) (466,942) 0.8% -11.4% 3.2% 3.2% 2.2% -1.5% -10.4% -100.0% 197,185,104 , 311,439 6,757,352 (6,757,352) (22,513,859) (6,488,743) (1,051,835) 80,417 1,163,548 Total nonoperating revenues (expenses) 183,543,266 182,876,433 177,524,406 666,833 0.4% 168,686,071 Net Income (deficit) before depreciation & amortization (10,695,417) (1,805,065) (12,029,763) (8,890,352) 492.5% (686,163) Depreciation <strong>and</strong> amortization 69,305,966 72,584,724 72,559,537 (3,278,758) -4.5% 75,490,541 Net surplus (deficit) $ (80,001,383) $ (74,389,789) $ (84,589,300) $ (5,611,594) 7.5% $ (76,176,704) 65
<strong>Metro</strong> <strong>Transit</strong> System Detail of Grants <strong>and</strong> Assistance <strong>Budget</strong> Summary Fiscal Year Ending June 30, <strong>2013</strong> $ Change % Change <strong>FY</strong> <strong>2013</strong> <strong>FY</strong> 2012 13 Bgt 13 Bgt <strong>FY</strong> 2011 <strong>Budget</strong> Projection <strong>Budget</strong> vs. 12 Proj vs. 12 Proj Actual Missouri subsidies: City of St. Louis 1/2 cent sales tax $ 16,579,725 $ 17,496,365 $ 16,191,203 $ (916,640) -5.2% $ 15,936,494 City of St. Louis 1/4 cent sales tax 7,121,511 7,612,620 7,113,316 (491,109) -6.5% 6,207,850 City of St. Louis Prop M2 sales tax 6,027,927 6,358,487 6,009,301 (330,560) -5.2% 4,654,707 Total City of St. Louis 29,729,163 31,467,472 29,313,820 (1,738,309) -5.5% 26,799,050 St. Louis County 1/2 cent sales tax 35,898,968 35,766,765 34,082,627 132,203 0.4% 34,025,669 St. Louis County 1/4 cent sales tax 28,797,921 28,839,493 26,664,612 (41,572) -0.1% 27,939,486 St. Louis County Prop A sales tax 43,482,610 41,360,000 41,316,000 2,122,610 5.1% 36,500,000 Total St. Louis County 108,179,499 105,966,258 102,063,239 2,213,241 2.1% 98,465,155 General <strong>Operating</strong> MODOT 196,671 196,671 196,671 0 0.0% 196,669 Non-capital Local Match 229,040 617,308 852,193 (388,268) -62.9% 841,448 Total State of Missouri 425,711 813,978 1,048,864 (388,267) -47.7% 1,038,117 Paratransit contracts 3,938,500 3,918,133 3,966,000 20,367 0.5% 3,753,095 Planning & demonstration reimbursement 160,000 160,000 160,000 (0) 0.0% 160,000 Total Missouri local & state subsidies: 142,432,873 142,325,841 136,551,923 107,032 0.1% 130,215,417 Illinois subsidies: Madison County 10,000 - - 10,000 10,978 St. Clair County 44,847,786 41,186,283 42,098,180 3,661,503 8.9% 39,992,390 State of Illinois 1,867,126 1,537,347 1,341,306 329,779 21.5% 613,547 Total Illinois local & state subsidies: 46,724,912 42,723,629 43,439,486 4,001,283 9.4% 40,616,915 Total local & state subsidies: 189,157,785 185,049,470 179,991,409 4,108,315 2.2% 170,832,333 Federal assistance: Vehicle maintenance subsidy 16,000,000 16,000,000 16,000,000 0 0.0% 16,000,000 CMAQ grant 178,000 2,681,178 2,919,096 (2,503,178) -93.4% 2,504,698 Non-capitalized project subsidy 1,978,142 1,919,062 1,763,978 59,080 3.1% 3,622,924 ARRA funds - 11,707 - (11,707) -100.0% 4,225,150 Total Federal assistance: 18,156,142 20,611,947 20,683,074 (2,455,805) -11.9% 26,352,771 Total grants & assistance $ 207,313,927 $ 205,661,417 $ 200,674,483 1,652,510 0.8% $ 197,185,104 Totals may not sum due to rounding 66
- Page 1 and 2:
Metro Operating and Capital Budget
- Page 3 and 4:
TABLE OF CONTENTS Budget Process Op
- Page 5 and 6:
TABLE OF CONTENTS Supplementary Met
- Page 7 and 8:
Board of Commissioners Illinois Mic
- Page 9 and 10:
March 23, 2012 Message from the Pre
- Page 11 and 12:
We are proud that Metro Transit is
- Page 13 and 14:
Louis, as well as audit positions w
- Page 15 and 16:
Bi-State Development Agency (d.b.a
- Page 17 and 18:
Bi-State Development Agency Profile
- Page 19 and 20: Community Profile Population and Cu
- Page 21 and 22: The America’s Center Convention C
- Page 23 and 24: Strategic Plan Overview Purpose of
- Page 25 and 26: Metro’s strategic alignment to Th
- Page 27 and 28: Linking Strategic Plan to Budgets -
- Page 29 and 30: Financial Policies, Fund Balances,
- Page 31 and 32: Department of Transportation. All i
- Page 33 and 34: Metro Operating and Capital Budget
- Page 35 and 36: Additional expenditure control tool
- Page 37 and 38: Fair Value of Financial Instruments
- Page 39 and 40: enefits under the plan and to const
- Page 41 and 42: Union Plans Salaried Plan 788 O&M 7
- Page 43 and 44: Debt Policies Legal Debt Limits Cur
- Page 45 and 46: Grants and Assistance All capital g
- Page 47 and 48: Financial Reserve Policies Restrict
- Page 49 and 50: Financing Instruments, Obligations
- Page 51 and 52: through a surety policy, the paymen
- Page 53 and 54: Long-Term Debt Debt and capital lea
- Page 55 and 56: Fiscal Interest Year Principal Expe
- Page 57 and 58: Series 2009 In October 2009, the Ex
- Page 59 and 60: Fiscal Interest Year Principal Expe
- Page 61 and 62: The Budget Process and Stakeholder
- Page 63 and 64: Capital Budget External Review and
- Page 65 and 66: FY 2013 Operating Budget Calendar S
- Page 67 and 68: Metro Transit System MetroBus Overv
- Page 69: Metro Transit System Call-A-Ride Ov
- Page 73 and 74: Passenger Revenue (in millions) 200
- Page 75 and 76: Parts & supplies expense is expecte
- Page 77 and 78: JARC grants include anticipated rev
- Page 79 and 80: Transit Operations . Operational ov
- Page 81 and 82: Objective: Improve service quality
- Page 83 and 84: Goal: To be an effective and effici
- Page 85 and 86: $ Change % Change FY 2013 FY 2012 1
- Page 87 and 88: Engineering & New Systems Developme
- Page 89 and 90: Engineering & New Systems Developme
- Page 91 and 92: Human Resources - Goals and Objecti
- Page 93 and 94: Human Resources - Operating Expense
- Page 95 and 96: Procurement, Inventory Management &
- Page 97 and 98: Procurement, Inventory Management &
- Page 99 and 100: Goals and Objectives Action Plan: S
- Page 101 and 102: Strategy Action Steps Performance M
- Page 103 and 104: Finance: Performance Indicators FY
- Page 105 and 106: Information Technology Organization
- Page 107 and 108: Communications & Community Relation
- Page 109 and 110: Communications & Community Relation
- Page 111 and 112: Strategy Action Steps Performance M
- Page 113 and 114: Real Estate and Economic Developmen
- Page 115 and 116: Metro Transit System Transit Improv
- Page 117 and 118: Other Federal assistance for non-ca
- Page 119 and 120: Metro Transit System Transit Improv
- Page 121 and 122:
Disabilities Act (ADA). Funds will
- Page 123 and 124:
Metro Transit System Capital Expend
- Page 125 and 126:
of the Grand Avenue Bridge Elevator
- Page 127 and 128:
Metro Transit System Impact of Capi
- Page 129 and 130:
Significant Capital Improvement Pro
- Page 131 and 132:
Metro System Transportation Improve
- Page 133 and 134:
FY 2013 Capital Programs and Projec
- Page 135 and 136:
FY 2013 - FY 2015 Capital Programs
- Page 137 and 138:
Metro System Transportation Improve
- Page 139 and 140:
Business Enterprises The Business E
- Page 141 and 142:
Gateway Arch Operating Budget Summa
- Page 143 and 144:
Expense Wages and benefits excludin
- Page 145 and 146:
Goals and Objectives Action Plan Th
- Page 147 and 148:
Business Enterprises Gateway Arch F
- Page 149 and 150:
Gateway Arch Parking Facility Opera
- Page 151 and 152:
Other revenue includes revenue from
- Page 153 and 154:
Goals and Objectives Action Plan Th
- Page 155 and 156:
Business Enterprises Gateway Arch P
- Page 157 and 158:
Riverfront Attractions Operating Bu
- Page 159 and 160:
Beverage revenue for FY 2013 is gen
- Page 161 and 162:
Gateway Arch Riverfront Attractions
- Page 163 and 164:
Business Enterprises St. Louis Down
- Page 165 and 166:
Business Enterprises St. Louis Down
- Page 167 and 168:
Other expense includes the followin
- Page 169 and 170:
Objective: Deliver quality capital
- Page 171 and 172:
Executive Services Operating Budget
- Page 173 and 174:
Expense Compensation and benefits f
- Page 175 and 176:
Goals and Objectives Action Plan Th
- Page 177 and 178:
Objective: Implement revenue enhanc
- Page 179 and 180:
FY 2013 FY 2012 FY 2011 Target Proj
- Page 181 and 182:
Executive Services - Operating Expe
- Page 183 and 184:
Business Enterprises Operating Budg
- Page 185 and 186:
Metro Employees by Division & Paygr
- Page 187 and 188:
Performance Indicators: Metro Trans
- Page 189 and 190:
Glossary CMAQ grant - A federal Con
- Page 191 and 192:
Glossary MoDOT - Missouri Departmen
- Page 193 and 194:
Glossary TRIP - Transit in the Park
- Page 195 and 196:
Glossary of Acronyms EWGCOG FASB FT
- Page 197 and 198:
Index of Tables, Lists, and Charts
- Page 199 and 200:
Index of Tables, Lists, and Charts
- Page 201 and 202:
Index of Tables, Lists, and Charts