Women in Latin America and the Caribbean - Cepal
Women in Latin America and the Caribbean - Cepal
Women in Latin America and the Caribbean - Cepal

Create successful ePaper yourself
Turn your PDF publications into a flip-book with our unique Google optimized e-Paper software.
35<br />
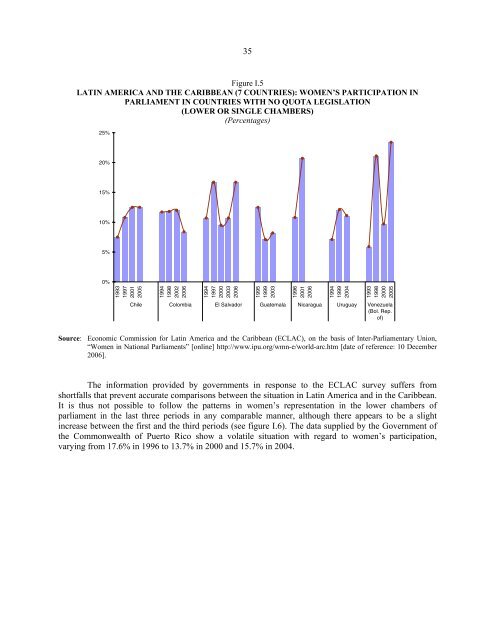
Figure I.5<br />
LATIN AMERICA AND THE CARIBBEAN (7 COUNTRIES): WOMEN’S PARTICIPATION IN<br />
PARLIAMENT IN COUNTRIES WITH NO QUOTA LEGISLATION<br />
(LOWER OR SINGLE CHAMBERS)<br />
(Percentages)<br />
25%<br />
20%<br />
15%<br />
10%<br />
5%<br />
0%<br />
1993<br />
1997<br />
2001<br />
2005<br />
1994<br />
1998<br />
2002<br />
2006<br />
1994<br />
1997<br />
2000<br />
2003<br />
2006<br />
1995<br />
1999<br />
2003<br />
1996<br />
2001<br />
2006<br />
1994<br />
1999<br />
2004<br />
1993<br />
1998<br />
2000<br />
2005<br />
Chile Colombia El Salvador Guatemala Nicaragua Uruguay Venezuela<br />
(Bol. Rep.<br />
of)<br />
Source: Economic Commission for Lat<strong>in</strong> <strong>America</strong> <strong>and</strong> <strong>the</strong> <strong>Caribbean</strong> (ECLAC), on <strong>the</strong> basis of Inter-Parliamentary Union,<br />
“<strong>Women</strong> <strong>in</strong> National Parliaments” [onl<strong>in</strong>e] http://www.ipu.org/wmn-e/world-arc.htm [date of reference: 10 December<br />
2006].<br />
The <strong>in</strong>formation provided by governments <strong>in</strong> response to <strong>the</strong> ECLAC survey suffers from<br />
shortfalls that prevent accurate comparisons between <strong>the</strong> situation <strong>in</strong> Lat<strong>in</strong> <strong>America</strong> <strong>and</strong> <strong>in</strong> <strong>the</strong> <strong>Caribbean</strong>.<br />
It is thus not possible to follow <strong>the</strong> patterns <strong>in</strong> women’s representation <strong>in</strong> <strong>the</strong> lower chambers of<br />
parliament <strong>in</strong> <strong>the</strong> last three periods <strong>in</strong> any comparable manner, although <strong>the</strong>re appears to be a slight<br />
<strong>in</strong>crease between <strong>the</strong> first <strong>and</strong> <strong>the</strong> third periods (see figure I.6). The data supplied by <strong>the</strong> Government of<br />
<strong>the</strong> Commonwealth of Puerto Rico show a volatile situation with regard to women’s participation,<br />
vary<strong>in</strong>g from 17.6% <strong>in</strong> 1996 to 13.7% <strong>in</strong> 2000 <strong>and</strong> 15.7% <strong>in</strong> 2004.