Women in Latin America and the Caribbean - Cepal
Women in Latin America and the Caribbean - Cepal
Women in Latin America and the Caribbean - Cepal

You also want an ePaper? Increase the reach of your titles
YUMPU automatically turns print PDFs into web optimized ePapers that Google loves.
85<br />
care to <strong>the</strong> “productive” adult population aged 18 to 64 <strong>and</strong> progressively higher scores to adolescents,<br />
children <strong>and</strong> <strong>the</strong> elderly, whose care needs are greater. 43<br />
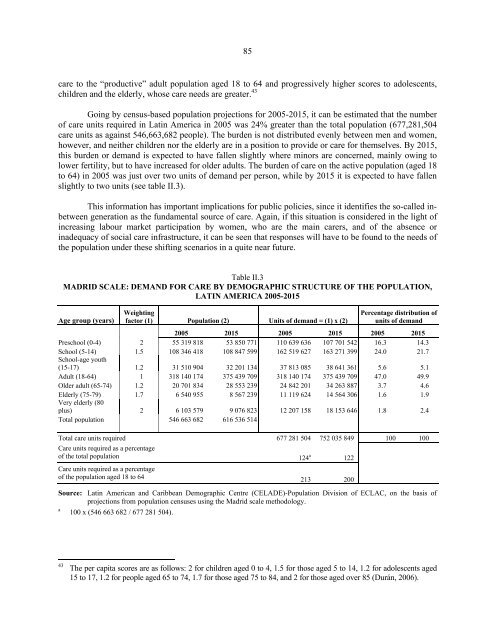
Go<strong>in</strong>g by census-based population projections for 2005-2015, it can be estimated that <strong>the</strong> number<br />
of care units required <strong>in</strong> Lat<strong>in</strong> <strong>America</strong> <strong>in</strong> 2005 was 24% greater than <strong>the</strong> total population (677,281,504<br />
care units as aga<strong>in</strong>st 546,663,682 people). The burden is not distributed evenly between men <strong>and</strong> women,<br />
however, <strong>and</strong> nei<strong>the</strong>r children nor <strong>the</strong> elderly are <strong>in</strong> a position to provide or care for <strong>the</strong>mselves. By 2015,<br />
this burden or dem<strong>and</strong> is expected to have fallen slightly where m<strong>in</strong>ors are concerned, ma<strong>in</strong>ly ow<strong>in</strong>g to<br />
lower fertility, but to have <strong>in</strong>creased for older adults. The burden of care on <strong>the</strong> active population (aged 18<br />
to 64) <strong>in</strong> 2005 was just over two units of dem<strong>and</strong> per person, while by 2015 it is expected to have fallen<br />
slightly to two units (see table II.3).<br />
This <strong>in</strong>formation has important implications for public policies, s<strong>in</strong>ce it identifies <strong>the</strong> so-called <strong>in</strong>between<br />
generation as <strong>the</strong> fundamental source of care. Aga<strong>in</strong>, if this situation is considered <strong>in</strong> <strong>the</strong> light of<br />
<strong>in</strong>creas<strong>in</strong>g labour market participation by women, who are <strong>the</strong> ma<strong>in</strong> carers, <strong>and</strong> of <strong>the</strong> absence or<br />
<strong>in</strong>adequacy of social care <strong>in</strong>frastructure, it can be seen that responses will have to be found to <strong>the</strong> needs of<br />
<strong>the</strong> population under <strong>the</strong>se shift<strong>in</strong>g scenarios <strong>in</strong> a quite near future.<br />
Table II.3<br />
MADRID SCALE: DEMAND FOR CARE BY DEMOGRAPHIC STRUCTURE OF THE POPULATION,<br />
LATIN AMERICA 2005-2015<br />
Age group (years)<br />
Weight<strong>in</strong>g<br />
factor (1) Population (2) Units of dem<strong>and</strong> = (1) x (2)<br />
Percentage distribution of<br />
units of dem<strong>and</strong><br />
2005 2015 2005 2015 2005 2015<br />
Preschool (0-4) 2 55 319 818 53 850 771 110 639 636 107 701 542 16.3 14.3<br />
School (5-14) 1.5 108 346 418 108 847 599 162 519 627 163 271 399 24.0 21.7<br />
School-age youth<br />
(15-17) 1.2 31 510 904 32 201 134 37 813 085 38 641 361 5.6 5.1<br />
Adult (18-64) 1 318 140 174 375 439 709 318 140 174 375 439 709 47.0 49.9<br />
Older adult (65-74) 1.2 20 701 834 28 553 239 24 842 201 34 263 887 3.7 4.6<br />
Elderly (75-79) 1.7 6 540 955 8 567 239 11 119 624 14 564 306 1.6 1.9<br />
Very elderly (80<br />
plus) 2 6 103 579 9 076 823 12 207 158 18 153 646 1.8 2.4<br />
Total population 546 663 682 616 536 514<br />
Total care units required 677 281 504 752 035 849 100 100<br />
Care units required as a percentage<br />
of <strong>the</strong> total population 124 a 122<br />
Care units required as a percentage<br />
of <strong>the</strong> population aged 18 to 64 213 200<br />
Source: Lat<strong>in</strong> <strong>America</strong>n <strong>and</strong> <strong>Caribbean</strong> Demographic Centre (CELADE)-Population Division of ECLAC, on <strong>the</strong> basis of<br />
projections from population censuses us<strong>in</strong>g <strong>the</strong> Madrid scale methodology.<br />
a<br />
100 x (546 663 682 / 677 281 504).<br />
43<br />
The per capita scores are as follows: 2 for children aged 0 to 4, 1.5 for those aged 5 to 14, 1.2 for adolescents aged<br />
15 to 17, 1.2 for people aged 65 to 74, 1.7 for those aged 75 to 84, <strong>and</strong> 2 for those aged over 85 (Durán, 2006).