Night noise guidelines for Europe - WHO/Europe - World Health ...
Night noise guidelines for Europe - WHO/Europe - World Health ...
Night noise guidelines for Europe - WHO/Europe - World Health ...

Create successful ePaper yourself
Turn your PDF publications into a flip-book with our unique Google optimized e-Paper software.
EXECUTIVE SUMMARY XV<br />
From source to source the number of separate events varies considerably. Road<br />
traffic <strong>noise</strong> is characterized by relatively low levels per event and high numbers,<br />
while air and rail traffic are characterized by high levels per event and low numbers.<br />
For two typical situations estimates have been made and presented in<br />
graphical <strong>for</strong>m. The first is an average urban road (600 motor vehicles per night,<br />
which corresponds roughly to a 24-hour use of 8000 motor vehicles, or 3 million<br />
per year, the lower boundary the END sets) and the second case is <strong>for</strong> an<br />
average situation of air traffic exposure (8 flights per night, nearly 3000 per<br />
year).<br />
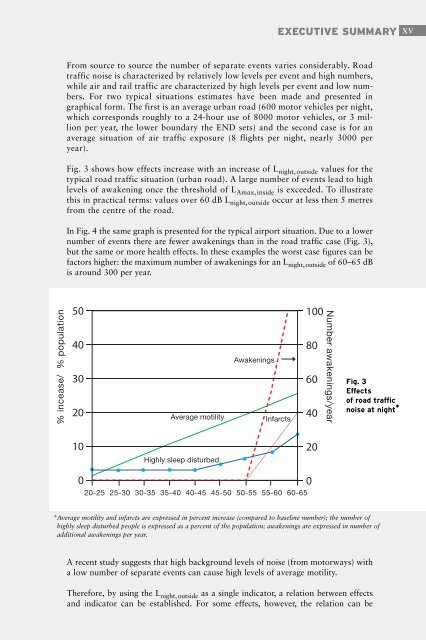
Fig. 3 shows how effects increase with an increase of L night, outside values <strong>for</strong> the<br />
typical road traffic situation (urban road). A large number of events lead to high<br />
levels of awakening once the threshold of L Amax, inside is exceeded. To illustrate<br />
this in practical terms: values over 60 dB L night, outside occur at less then 5 metres<br />
from the centre of the road.<br />
In Fig. 4 the same graph is presented <strong>for</strong> the typical airport situation. Due to a lower<br />
number of events there are fewer awakenings than in the road traffic case (Fig. 3),<br />
but the same or more health effects. In these examples the worst case figures can be<br />
factors higher: the maximum number of awakenings <strong>for</strong> an L night,outside of 60–65 dB<br />
is around 300 per year.<br />
% incease/ % population<br />
50<br />
40<br />
30<br />
20<br />
Average motility<br />
Awakenings<br />
Infarcts<br />
100<br />
80<br />
60<br />
40<br />
Number awakenings/year<br />
Fig. 3<br />
Effects<br />
of road traffic<br />
<strong>noise</strong> at night *<br />
10<br />
Highly sleep disturbed<br />
20<br />
0<br />
20-25 25-30 30-35 35-40 40-45 45-50 50-55 55-60 60-65<br />
0<br />
*Average motility and infarcts are expressed in percent increase (compared to baseline number); the number of<br />
highly sleep disturbed people is expressed as a percent of the population; awakenings are expressed in number of<br />
additional awakenings per year.<br />
A recent study suggests that high background levels of <strong>noise</strong> (from motorways) with<br />
a low number of separate events can cause high levels of average motility.<br />
There<strong>for</strong>e, by using the L night,outside as a single indicator, a relation between effects<br />
and indicator can be established. For some effects, however, the relation can be