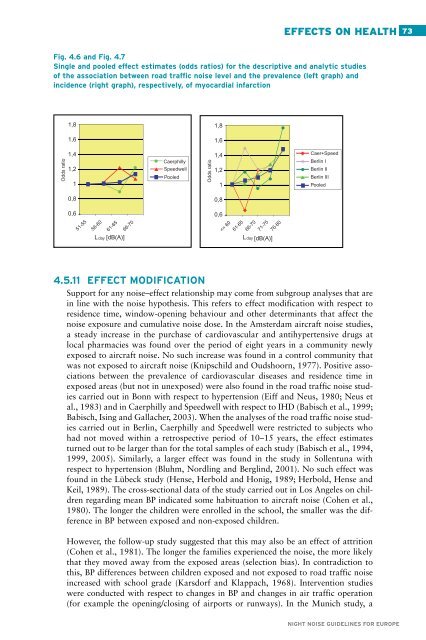
72 EFFECTS ON HEALTH 4.5.10 DOSE–RESPONSE CURVE: META-ANALYSIS For a quantitative risk assessment and the derivation of <strong>guidelines</strong> <strong>for</strong> public health <strong>noise</strong> policy a common dose–response curve is required. The risk estimates obtained from different <strong>noise</strong> studies can be summarized using the statistical approach of a meta-analysis. Based on the judgement criteria discussed in section 4.5.9.2, five analytic and two descriptive studies emerged that can be used to derive a common dose–response curve <strong>for</strong> the association between road traffic <strong>noise</strong> and the risk of myocardial infarction. Two separate meta-analyses were made by considering the analytic studies that were carried out in Caerphilly and Speedwell (cohort studies) and Berlin (case-control studies) on the one hand, and the descriptive studies that were carried out in Caerphilly and Speedwell (cross-sectional studies) on the other hand. It turned out, as a result of the evaluation, that all these studies referred to road traffic <strong>noise</strong> during the day (L day : 06.00–22.00) and the incidence or prevalence of myocardial infarction as the outcome. Study subjects were men. In all analytic studies the orientation of rooms was considered <strong>for</strong> the exposure assessment (facing the street or not). With respect to the Caerphilly and Speedwell studies, the six years of pooled follow-up data provided the respective in<strong>for</strong>mation. In all descriptive studies the traffic <strong>noise</strong> level referred to the facades that were facing the street and did not consider the orientation of rooms/windows. All individual effect estimates were adjusted <strong>for</strong> the covariates considered in each of the studies. Different sets of covariates were considered in each study. However, this pragmatic approach accounts best <strong>for</strong> possible confounding in each study and provides the most reliable effect estimates derived from each study. The concept of meta-analysis was used to aggregate and summarize the findings of the different studies (Olkin, 1995; Blettner et al., 1999). The program “meta” was downloaded from the “STATA” web site <strong>for</strong> use in the statistical package STATA (version 8.0), and <strong>for</strong> calculating the pooled random effect estimates. Table 4.2 Single and pooled (meta-analysis) effect estimates (odds ratios and 95% confidence intervals) of descriptive and analytic studies on the relationship between road traffic <strong>noise</strong> level (L day ) and the incidence/prevalence of myocardial infarction Road traffic <strong>noise</strong> level - L day [dB(A)] Descriptive studies 51-55 56-60 61-65 66-70 N Caerphilly 1.00 1.00 (0.58-1.71),[13.29] 0.90 (0.56-1.44),[17.23] 1.22 (0.63-2.35),[ 8.98] 2512 Speedwell 1.00 1.02 (0.57-1.83),[11.19] 1.22 (0.70-2.21),[12.62] 1.07 (0.59-1.94),[10.94] 2348 Pooled 1.00 1.01 (0.68-1.50) 1.02 (072-1.47) 1.14 (0.73-1.76) Q-Test p=0.96 p=0.41 p=0.77 Analytic studies ≤ 60 61-65 66-70 71-75 76-80 N Caerphilly + Speedwell 1.00 0.65 (0.27-1.57),[ 4.95] 1.18 (0.74-1.89),[17.48] --- --- 3950 Berlin I 1.00 1.48 (0.57-3.85),[ 4.21] 1.19 (0.49-2.87),[ 4.94] 1.25 (0.41-3.81),[ 3.09] 1.76 (0.11-28.5),[0.50] 243 Berlin II 1.00 1.16 (0.82-1.65),[31.43] 0.94 (0.62-1.42),[22.76] 1.07 (0.68-1.68),[18.92] 1.46 (0.77-2.78),[9.27] 4035 Berlin III 1.00 1.01 (0.77-1.32),[54.42] 1.13 (0.86-1.49),[50.87] 1.27 (0.88-1.84),[28.24] --- 4115 Pooled 1.00 1.05 (0.86-1.29) 1.09 (0.90-1.34) 1.19 (0.90-1.57) 1.47 (0.79-2.76) Q-Test p=0.57 p=0.87 p=0.84 p=0.90 Table 4.2 shows individual and pooled effect estimates with confidence intervals (rounded brackets), statistical weights (square brackets) <strong>for</strong> the individual studies, and the Q-test of heterogeneity between studies. According to the Q-test, the nil hypothesis of non-heterogeneity was never discarded. Figs 4.6 and 4.7 show odds ratios of individual studies and the pooled estimates <strong>for</strong> the descriptive and analytic studies. NIGHT NOISE GUIDELINES FOR EUROPE
EFFECTS ON HEALTH 73 Fig. 4.6 and Fig. 4.7 Single and pooled effect estimates (odds ratios) <strong>for</strong> the descriptive and analytic studies of the association between road traffic <strong>noise</strong> level and the prevalence (left graph) and incidence (right graph), respectively, of myocardial infarction 1,8 1,8 1,6 1,6 Odds ratio 1,4 1,2 1 Caerphilly Speedwell Pooled Odds ratio 1,4 1,2 1 Caer+Speed Berlin I Berlin II Berlin III Pooled 0,8 0,8 0,6 51-55 56-60 Lday 61-65 [dB(A)] 66-70 0,6